
5 Aggregate specific usage of Services
5.1 General
OPC 10000-4 specifies all Services needed for OPC UA Aggregates. In particular:
The Browse Service Set or Query Service Set to detect Aggregates and their configuration.
The HistoryRead Service of the Attribute Service Set to read the aggregated history of the HistoricalNodes.
The CreateMonitoredItems Service allows specifying a filter for each MonitoredItem to read aggregated data.
5.2 Aggregate data handling
5.2.1 Overview
The HistoryRead service defined in OPC 10000-4 can perform several different functions. The historyReadDetails parameter is an Extensible Parameter that specifies which function to perform. The ReadProcessedDetails structure is used to read aggregated data for HistoricalDataNodes.
The CreateMonitoredItems Service allows specifying a filter for each MonitoredItem. The MonitoringFilter is an extensible parameter whose structure depends on the type of item being monitored. The AggregateFilter structure is used to obtain aggregated data for a subscription.
5.2.2 ReadProcessedDetails structure overview
ReadProcessedDetails structure is formally detailed in OPC 10000-11. Table 43 outlines the components of the ReadProcessedDetails structure for the purposes of discussion in this document.
| Name | Description |
|---|---|
| ReadProcessedDetails | Specifies the details used to perform a “processed” history read. |
startTime | Beginning of period to read. |
endTime | End of period to read. |
processingInterval | Interval between returned Aggregate values. |
aggregateType[] | The NodeIds of the AggregateFunction Objects. AggregateFunction Objects indicate the list of Aggregates to be used when retrieving processed history. |
aggregateConfiguration | Aggregate configuration structure. |
useServerDefaults | If True the Server’s default values are used and any values specified for the other parameters are ignored. |
treatUncertainAsBad | See 4.2.1.2. |
percentDataBad | See 4.2.1.2. |
percentDataGood | See 4.2.1.2. |
useSlopedExtrapolation | See 4.2.1.2. |
5.2.3 AggregateFilter structure overview
The AggregateFilter defines the Aggregate function that should be used to calculate the values to be returned. The AggregateFilter is formally defined in OPC 10000-4. Table 44 outlines the components of the AggregateFilter structure for the purposes of discussion in this document.
| Name | Description |
|---|---|
| AggregateFilter | |
startTime | Beginning of period to calculate the Aggregate the first time. |
aggregateType | The NodeIds of the AggregateFunction Objects that indicates the list of Aggregates to be used when retrieving processed data. |
processingInterval | The period to be used to compute the Aggregate. |
aggregateConfiguration | This parameter allows Clients to override the Aggregate configuration settings supplied by an AggregateConfiguration Object on a per monitored item basis. |
useServerDefaults | If True the Server’s default values are used and any values specified for the other parameters are ignored. |
treatUncertainAsBad | See 4.2.1.2. |
percentDataBad | See 4.2.1.2. |
percentDataGood | See 4.2.1.2. |
useSlopedExtrapolation | See 4.2.1.2. |
5.3 Aggregates StatusCodes
5.3.1 Overview
Subclause 5.3 defines additional codes and rules that apply to the StatusCode when used for Aggregates.
The general structure of the StatusCode is specified in OPC 10000-4. It includes a set of common operational result codes which also apply to Aggregates.
5.3.2 Operation level result codes
In OPC UA Aggregates the StatusCode is used to indicate the conditions under which a value or Event was stored, and thereby can be used as an indicator of its usability. Due to the nature of aggregated data, additional information beyond the basic quality and call result code needs to be conveyed to the client. For example, whether or not the result was Interpolated, were all data inputs to a calculation of Good quality, etc.
In the following, Table 45 contains codes with Bad severity indicating a failure; Table 46 contains codes with Uncertain severity indicating that the value has been retrieved under sub-normal conditions. It is important to note, that these are the codes that are specific for
OPC UA Aggregates and that they supplement the codes that apply to all types of data; they are therefore defined in OPC 10000-4, OPC 10000-8 and OPC 10000-11.
| Symbolic Id | Description |
| Bad_AggregateListMismatch | The requested number of Aggregates does not match the requested number of NodeIds. When multiple Aggregates are requested, a corresponding NodeId is required for each AggregateFunction. |
| Bad_AggregateNotSupported | The requested AggregateFunction is not supported by the Server for the specified Node. |
| Bad_AggregateInvalidInputs | The Aggregate value could not be derived due to invalid data inputs, errors attempting to perform data conversions or similar situations. |
| Symbolic Id | Description |
| Uncertain_DataSubNormal | The value is derived from raw values and has less than the required number of Good values. |
5.3.3 Aggregate Information Bits
5.3.3.1 General
These bits are set only when obtaining Aggregate data. They indicate where the data value came from and provide information that affects how the client uses the data value. Table 47 lists the bit settings which indicate the data location (i.e. is the value stored in the underlying data repository, or is the value the result of data aggregation). These bits are mutually exclusive.
| StatusCode | Description |
| Raw | A Raw data value. |
| Calculated | A data value which was calculated. |
| Interpolated | A data value which was interpolated. |
In the case where Interpolated data is requested, and there is an actual raw value for that timestamp, the Server should set the ‘Raw’ bit in the StatusCode of that value.
Table 48 lists the bit settings which indicate additional important information about the data values returned.
| StatusCode | Description |
| Partial | A calculated value that is not based on a complete interval. See 5.3.3.2. |
| Extra Data | If a Server chooses to set this bit, it indicates that a Raw data value supersedes other data at the same timestamp. |
| Multiple Values | Multiple values match the Aggregate criteria (i.e. multiple minimum values or multiple worst quality at different timestamps within the same ProcessingInterval). |
The conditions under which these information bits are set depend on how the data has been requested and state of the underlying data repository.
5.3.3.2 Partial Information bit
Partial bit is used to indicate that the interval is not a complete interval and that a client may receive a different value for the Aggregate if it re-fetches the interval with the same parameters.
The Partial bit will be set in the following examples:
Assume for these examples the first stored point in the collection is 1:01:10 and the last stored point in the collection is 1:31:20. Older data may exist but is unavailable or offline at the time of the query. Newer data may be available but has not yet been stored in the history collection.
The interval that overlaps the beginning of the history collection. If the start time is 1:00:00 and end time is 1:10:00 and the interval is 2 minutes then the first interval would have a Partial bit set since it has no data for the first 70 seconds. The Partial bit will always be set for the first interval with data if the start time of the interval is before the first data value of the data collection. For intervals prior to the interval with a Partial bit, these intervals will be flagged Bad_NoData.
The interval that overlaps the latest point stored in the history collection. The last point in the collection is 1:31:20 and the historian was not shut down and is still running. A 6-minute interval that started at 1:30:00 would have the Partial bit set because the historian is expecting data, but just has not yet received anything. The Partial bit will always be set for the last interval with data if the end time of the interval is after the last data value stored in the data collection. Intervals entirely after the interval with a Partial bit will be flagged Bad_NoData. For those Aggregates with extrapolation, the Partial bit may be set. See the Aggregate specific characteristics for more details.
If the start/end time does not result in an even interval and there is additional data beyond the end time then the last interval will have a Partial bit. If the start time is 1:00:00 and end time is 1:20:00 and the interval is 6 minutes then the last interval is just 2 minutes long and will have the Partial bit set. Extrapolation does not apply in this case.
The Partial bit may be set with the Calculated bit when the Calculated bit is always set for the specific Aggregate.
5.4 Aggregate details
5.4.1 General
The purpose of subclause 5.4 is to detail the requirements and behaviour for OPC UA Servers supporting Aggregates. The intent is to standardize the Aggregates so users can reliably predict the results of an Aggregate computation and understand its meaning. If users require custom functionality in the Aggregates, those Aggregates should be written as custom vendor defined Aggregates.
The standard Aggregates shall be as consistent as possible, meaning that each Aggregate’s behaviour shall be similar to every other Aggregate’s behaviour where input parameters, Raw data, and boundary conditions are similar. Where possible, the Aggregates should deal with input and preconditions in a similar manner.
Subclause 5.4 is divided up into two parts. Subclause 5.4.2 deals with Aggregate characteristics and behaviour that are common to all Aggregates. Subclause 5.4.3 deals with the characteristics and behaviour of Aggregates that are aggregate-specific.
5.4.2 Common characteristics
5.4.2.1 Description
Subclause 5.4.2 deals with Aggregate characteristics and behaviour that are common to all Aggregates.
5.4.2.2 Generating intervals
To read Historical Aggregates, OPC clients shall specify three time parameters:
startTime (Start)
endTime (End)
ProcessingInterval (Int)
The OPC Server shall use these three parameters to generate a sequence of time intervals and then calculate an Aggregate for each interval. Subclause 5.4.2.2 specifies, given the three parameters, which time intervals are generated. Table 49 provides information on the intervals for each Start and End time combination. The range is defined to be |End - Start|.
All Aggregates return a timestamp of the start of the interval unless otherwise noted for the particular Aggregate.
| Start/End Time | Interval | Resulting intervals |
|---|---|---|
| Start = End | Int = Anything | No intervals. Returns a Bad_InvalidArgument StatusCode, regardless of whether there is data at the specified time or not. |
| Start < End | Int = 0 or Int ≥ Range | One interval, starting at Start and ending at End. Includes Start, excludes End, i.e., [Start, End). |
| Start < End | Int ≠ 0, Int < Range, Int divides Range evenly. | Range/Int intervals. Intervals are [Start, Start + Int), [Start + Int, Start + 2 x Int),..., [End - Int, End). |
| Start < End | Int ≠ 0, Int < Range, Int does not divide Range evenly. | Range/Int intervals. Intervals are [Start, Start + Int), [Start + Int, Start + 2 x Int),..., [Start + ( Range/Int - 1) x Int, Start + Range/Int x Int), [Start + Range/Int x Int, End). In other words, the last interval contains the “rest” that remains in the range after taking away Range/Int intervals of size Int. |
| Start > End | Int = 0 or Int ≥ Range | One interval, starting at Start and ending at End. Includes Start, excludes End, i.e.,[Start, End). a |
| Start > End | Int ≠ 0, Int < Range, Int divides Range evenly. | Range/Int intervals. Intervals are [Start, Start- Int), [Start– Int, Start – 2 x Int),..., [End + Int, End). a |
| Start > End | Int ≠ 0, Int < Range, Int does not divide Range evenly. | Range/Int intervals. Intervals are [Start, Start - Int), [Start –Int,Start - 2 x Int),..., [Start – ( Range/Int - 1) x Int , Start - Range/Int x Int), [Start - Range/Int x Int , End). In other words, the last interval contains the “rest” that remains in the range after taking away Range/Int intervals of size Int starting at Start. a |
| a In this case time is running backwards on the intervals. | ||
The calculation of all Aggregates when time flows backwards is the same as when time flows forwards with the exception that the ‘early time’ is excluded from the interval and the ‘late time’ is included. In most cases this means the value will be the same except the timestamps are shifted by one ProcessingInterval. E.g. when time flows forward the value at T = n is the same as the value at T = n + 1 when time flows backward.
Note that when determining Aggregates with MonitoredItem, the interval is simply the ProcessingInterval parameter as defined in the AggregateFilter structure. See OPC 10000-4 for more details.
5.4.2.3 Data types
Table 50 outlines the valid DataType for each Aggregate. Some Aggregates are intended for numeric data types – i.e. integers or real/floating point numbers. Dates, strings, arrays, etc. are not supported. Other Aggregates are intended for digital data types – i.e. Boolean or enumerations. In addition some Aggregates may return results with a different DataType than those used to calculate the Aggregate. Table 50 also outlines the data type returned for each Aggregate.
| BrowseName | Valid Data Type | Result Data Type |
|---|---|---|
| Interpolation Aggregate | ||
| Interpolative | Numeric | Raw Data Type |
| Data Averaging Aggregates | ||
|---|---|---|
| Average | Numeric | Double |
| TimeAverage | Numeric | Double |
| TimeAverage2 | Numeric | Double |
| Total | Numeric | Double |
| Total2 | Numeric | Double |
| Data Variation Aggregates | ||
|---|---|---|
| Minimum | Numeric | Raw data type |
| Maximum | Numeric | Raw data type |
| MinimumActualTime | Numeric | Raw data type |
| MaximumActualTime | Numeric | Raw data type |
| Range | Numeric | Raw data type |
| Minimum2 | Numeric | Raw data type |
| Maximum2 | Numeric | Raw data type |
| MinimumActualTime2 | Numeric | Raw data type |
| MaximumActualTime2 | Numeric | Raw data type |
| Range2 | Numeric | Raw data type |
| Counting Aggregates | ||
|---|---|---|
| AnnotationCount | All | Integer |
| Count | All | Integer |
| DurationInStateZero | Numeric or Boolean | Duration |
| DurationInStateNonZero | Numeric or Boolean | Duration |
| NumberOfTransitions | Numeric or Boolean | Integer |
| Time Aggregates | ||
|---|---|---|
| Start | All | Raw data type |
| End | All | Raw data type |
| Delta | Numeric | Raw data type |
| StartBound | All | Raw data type |
| EndBound | All | Raw data type |
| DeltaBounds | Numeric | Raw data type |
| Data Quality Aggregates | ||
|---|---|---|
| DurationGood | All | Duration |
| DurationBad | All | Duration |
| PercentGood | All | Double |
| PercentBad | All | Double |
| WorstQuality | All | StatusCode |
| WorstQuality2 | All | StatusCode |
| Statistical Aggregates | ||
|---|---|---|
| StandardDeviationSample | Numeric | Double |
| VarianceSample | Numeric | Double |
| StandardDeviationPopulation | Numeric | Double |
| VariancePopulation | Numeric | Double |
5.4.2.4 Time calculation issues
The following issues may come up when calculating Aggregates that include time as part of the calculation.
All Aggregate calculations include the startTime but exclude the endTime. However, it is sometimes necessary to return an Interpolated End Bound as the value for an Interval with a timestamp that is in the Interval. Servers are expected to use the time immediately before endTime where the time resolution of the Server determines the exact value (do not confuse this with hardware or operating system time resolution). For example, if the endTime is 12:01:00, the time resolution is 1 second, then the EffectiveEndTime is 12:00:59. If the Server time resolution is 1 millisecond the EffectiveEndTime is 12:00:59.999.
If time is flowing backwards, Servers are expected to use the time immediately after endTime where the time resolution of the Server determines the exact value.
If there is one data point in the Interval and it falls on the StartTime the time duration used in calculations is one unit of the time resolution of the Server.
5.4.3 Specific aggregated data handling
5.4.3.1 General
When accessing aggregated data using the HistoryRead or the CreateMonitoredItems Service, the following rules are used to handle specific Aggregate use cases.
If ProcessingInterval is 0, the Server shall create one Aggregate value for the entire time range. This allows Aggregates over large periods of time. A value with a timestamp equal to endTime will be excluded from that Aggregate, just as it would be excluded from an interval with that ending time. If the ProcessingInterval of 0 is passed in the MonitoredItemFilter it shall be revised to a suitable non-zero value.
The timestamp returned with the Aggregate shall be the time at the beginning of the interval, except where the Aggregate specifies a different timestamp.
If a requested timestamp is set to anything but the source timestamp the operation shall return the Bad_TimestampToReturnInvalid StatusCode. If a requested timestamp is not supported in any other way for a HistoricalDataNode, the operation shall return the Bad_TimestampNotSupported StatusCode. For MonitoredItem the Server shall not return past data if a requested timestamp is not supported by the history collection.
5.4.3.2 StatusCode calculation
5.4.3.2.1 General
StatusCodes for an Aggregate value shall take into account the values used to calculate them. In addition, the configuration parameters PercentDataGood and PercentDataBad allow the client to control how this calculation is done if supported by the Server.
If an Aggregate operates on raw values (e.g. Average) the calculation is done by counting values. If an Aggregate operates on raw values but can also return a Bounding Value then the Bounding Values are included in the count when computing the StatusCode. If an Aggregate does any sort of a time weighted calculation (e.g. TimeAverage or TimeAverage2) then the StatusCode calculation shall also be time weighted.
For purposes of calculating time weighted StatusCodes each interval shall be divided into regions of Good or Bad data. Creating these regions requires that the bounding values be calculated for each interval and the type of bounding value depends on the Aggregate.
Use the following to determine the StatusCode of a given aggregate. If TreatUncertainAsBad = False then Uncertain regions are included with the Good regions when calculating the above ratios, if the TreatUncertainAsBad = True then the Uncertain regions are included as Bad regions. If no Bad regions are in the interval then the StatusCode for the interval is Good. For any intervals containing regions where the StatusCodes are Bad, the total duration of all Bad regions is calculated and divided by the width of the interval. The resulting ratio is multiplied by 100 and compared to the PercentDataBad parameter. The StatusCode for the interval is Bad if the ratio is greater than or equal to the PercentDataBad parameter. For any interval which is not Bad, the total duration of all Good regions is then calculated and divided by the width of the interval. The resulting ratio is multiplied by 100 and compared to the PercentDataGood parameter. The StatusCode for the interval is Good if the ratio is greater than or equal to the PercentDataGood parameter. If for an interval neither ratio applies then that interval is Uncertain_DataSubNormal.
If there is no data in the interval and the interval is inside the range [start of data, end of data] and the Aggregate return data type is raw data type then the StatusCodes for the interval will be Bad_NoData unless an alternate status code is defined for a specific Aggregate.
The width of an interval is the ProcessingInterval unless it is a partial interval (i.e. has the Partial bit set). In these cases, the width is the time used when calculating the partial interval.
Subclauses 5.4.3.2.2 and 5.4.3.2.3 include diagrams that illustrate a request and data series. The colour of the time axis indicates the status for different regions. Red indicates Bad, green indicates Good and orange indicates Uncertain. These examples assume TreatUncertainAsBad = False.
5.4.3.2.2 Sloped Interpolation and Simple Bounding Values
Figure 2 illustrates a data series for Variable with Stepped = False and an Aggregate that uses Simple Bounding Values. The request being processed has a Start Time that falls before the first point in the series and an End Time that does not fall on an integer multiple of the ProcessingInterval.
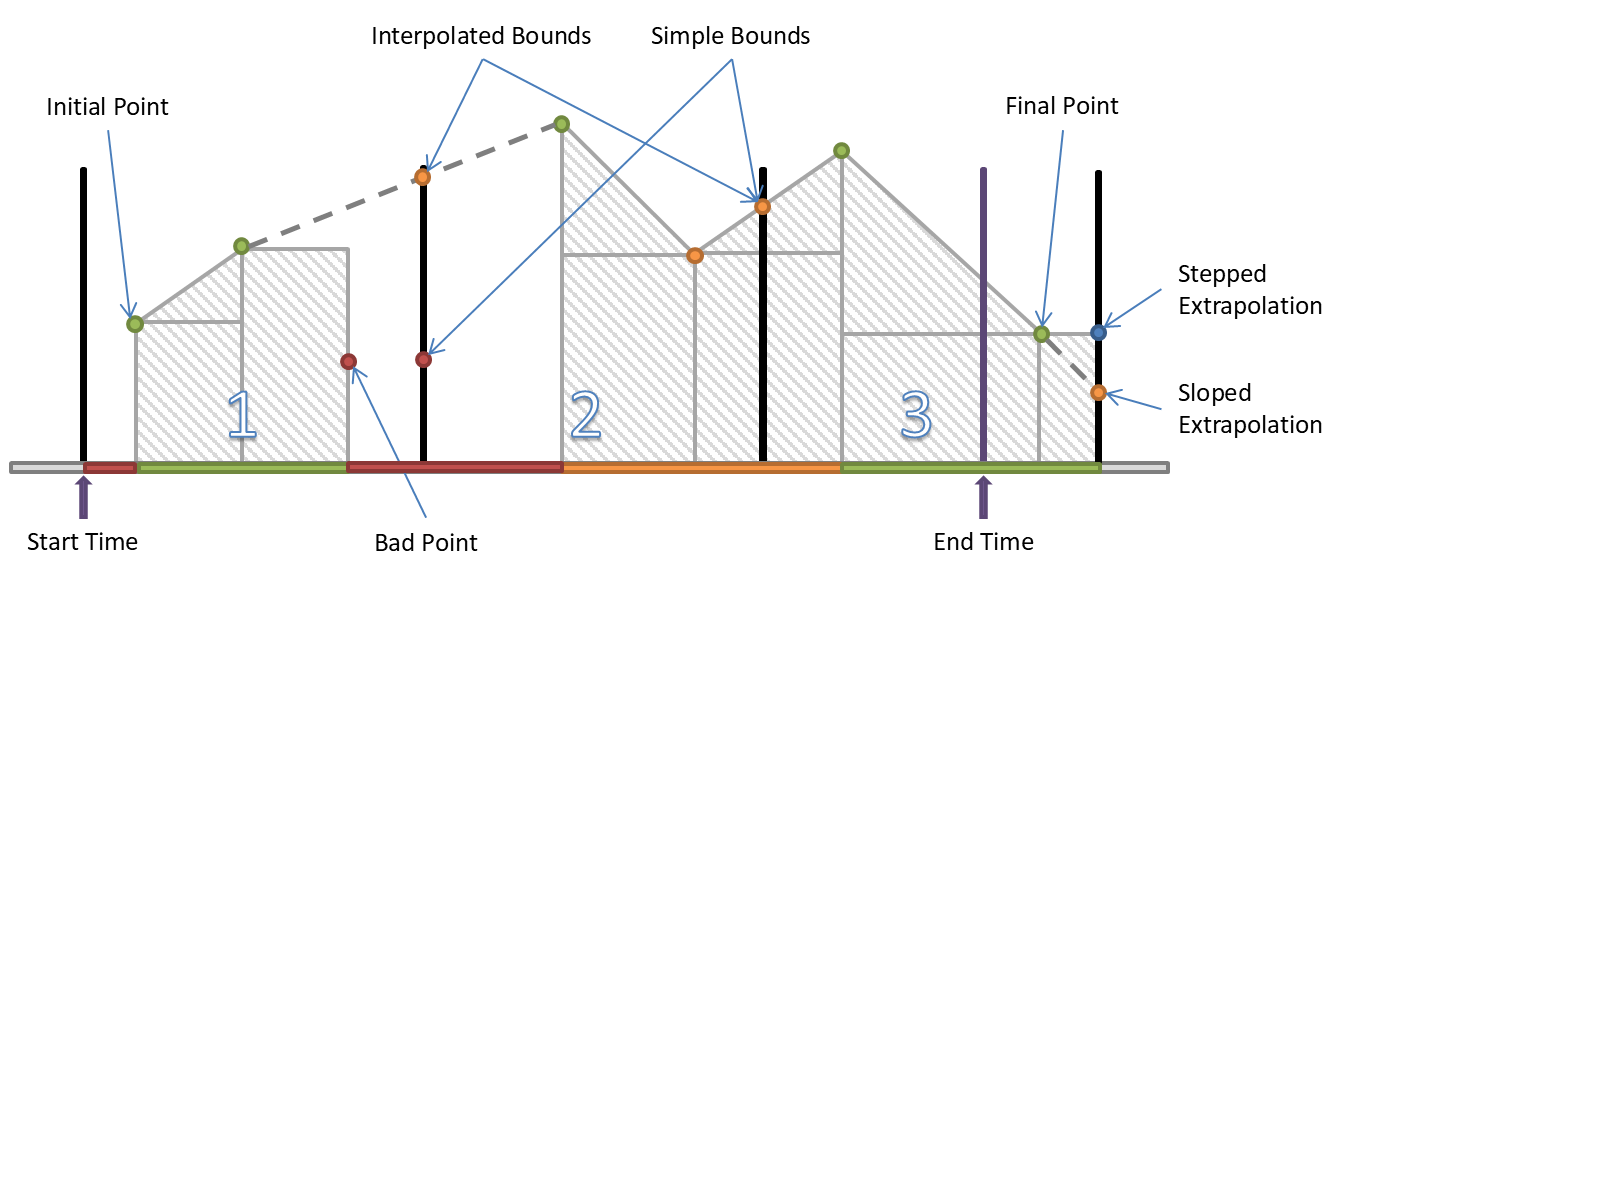
The first interval has four regions:
the period before the first data point;
the period between the first and second where SlopedInterpolation can be used;
the period between the second and third point where SteppedInterpolation is used;
the period after the Bad point where no data exists.
A region is Uncertain if a region ends in a Bad or Uncertain value and SlopedInterpolation is used. The end point has no effect on the region if SteppedInterpolation is used.
The second interval has three regions:
the period before the first Good data point where no data exists;
the period between the first and second where SlopedInterpolation can be used;
the period between the second point and the bound calculated with SlopedInterpolation.
The third interval has three regions:
the period between the simple bound and the first data point;
the period between the first point and an interpolated point that falls on the end time;
the period after the end time which is ignored.
This is a partial region and the data after the end time is not used, however, if sloped interpolation is used and the point after the endpoint is Uncertain then the region between the last point and the end time will be Uncertain.
5.4.3.2.3 Stepped Interpolation and Interpolated Bounding Values
Figure 3 illustrates a data series for Variable with Stepped = True and an Aggregate that uses Interpolated Bounding Values. The request being processed has a Start Time that falls before the first point in the series and an End Time that does not fall on an integer multiple of the ProcessingInterval.
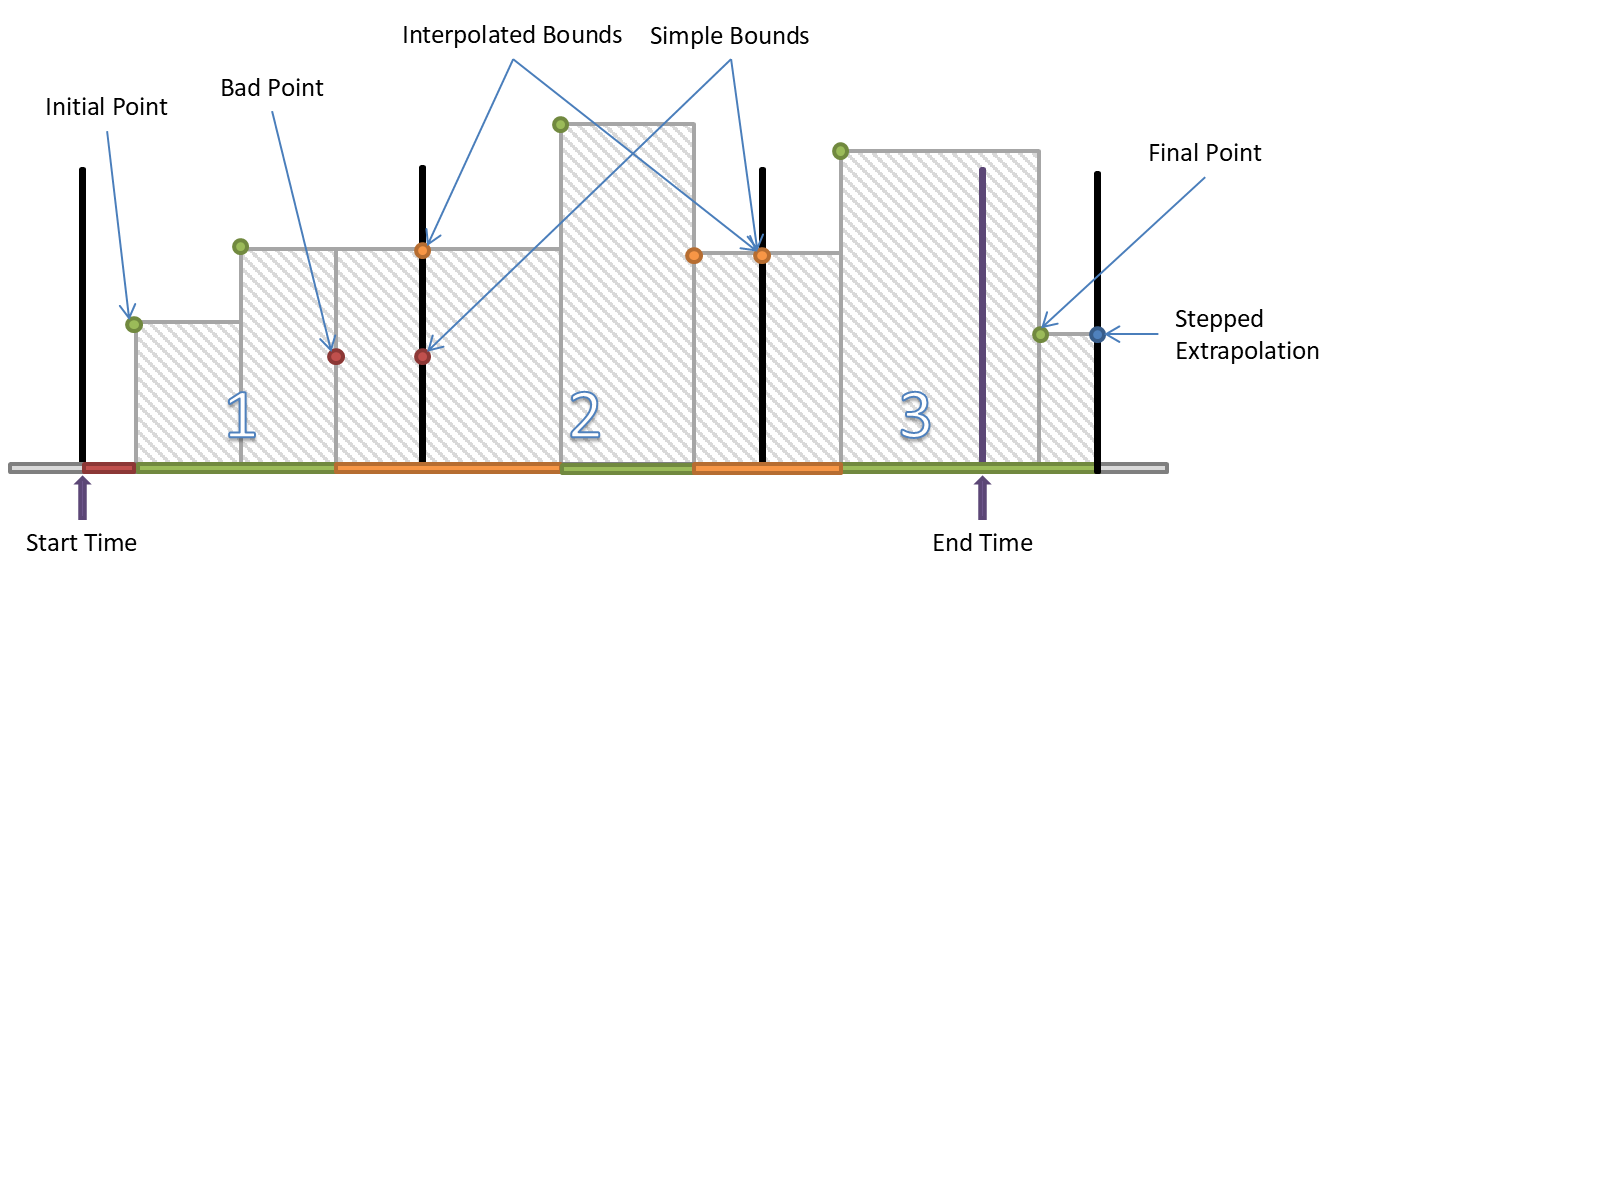
The first interval has three regions:
the period before the first data point;
the period between the first and second where SteppedInterpolation is used;
the period between the second and the interpolated end bound.
The Bad point is ignored because of the interpolated end bound but this does create Uncertain regions. If SlopedInterpolation was used the Uncertain region would start at the second point. In this case, it only starts when the first Bad value is ignored.
The second interval has three regions:
the period between the start bound and the first data point;
the period between the first and second where SteppedInterpolation is used;
the period between the second and the interpolated end bound.
The third interval has three regions:
the period between the interpolated bound and the first data point;
the period between the first point and an interpolated point that falls on the end time;
the period after the end time which is ignored.
This is a partial region and the data after the end time is not used.
5.4.3.3 Description
Subclause 5.4.3.3 deals with Aggregate specific characteristics and behaviour that is specific to a particular Aggregate.
Each subclause has a table which formally expresses the Aggregate behaviour (including any exceptions). The meaning of each of the fields in the table is described in Table 51.
Description of Table 51:
The first column is the common name for the item.
The second column includes a description of the item and a list of the valid selections with for the item including a description of each selection.
The second part of the table describes how the status associated with the Aggregate calculation is computed.
The last part of the table lists what behaviour is expected from the Aggregate for some common special cases. These behaviours require text descriptions so there is no list of valid selections.
| Aggregate Characteristics | |
| Type | The type of Aggregate. <Interpolated | Calculated | Raw> Interpolated: See definition for Interpolated. Calculated: Computed from defined calculation. Raw: Selects a raw value from within an interval. |
| Data Type | The data type of the result. <Double | Int32 | Same as Source> |
| Use Bounds | How the Aggregate deals with bounds. <None | Interpolated | Simple> None: Bounds do not apply to the Aggregate. Interpolated: Uses Interpolated Bounds. Simple: Uses Simple Bounds. |
| Timestamp | What is the time stamp of the resulting Aggregate value: <startTime | endTime | Raw> startTime: The time at the start of the interval. endTime: The time at the end of the interval. Raw: The time associated with a value in the interval. |
| StatusCode Calculations | |
|---|---|
| Calculation Method | How the status code is calculated: <PercentValues | PercentTime | Custom> PercentValues: Based on percentage of value counts. PercentTime: Based on percentage of time interval. Custom: Specific to the Aggregate (description included). |
| Partial | For partial intervals does the Aggregate set this bit <Set Sometimes | Not Set> It may also describe any special cases for setting this bit |
| Calculated | Describes the usage of the calculated bit. <Set Always | Set Sometimes | Not Set> Set Always: The bit is always set. Set Sometimes: The bit is sometimes set (describes when). Not Set: The bit is never set. |
| Interpolated | Describes the usage of the interpolated bit. <Set Always | Set Sometimes | Not Set> Set Always: The bit is always set. Set Sometimes: The bit is sometimes set (describes when). Not Set: The bit is never set. |
| Raw | Describes the usage of the Raw bit. <Set Always | Set Sometimes | Not Set> Set Always: The bit is always set. Set Sometimes: The bit is sometimes set (describes when). Not Set: The bit is never set. |
| Multi Value | Describes the usage of the multi value bit. <Set Sometimes | Not Set> Set Sometimes: The bit is used (see OPC 10000-11). Not Set: The bit is never set. |
| StatusCode Common Special Cases | |
|---|---|
| Before Start of Data | If the entire interval is before the start of data. |
| After End of Data | If the entire interval is after the end of data (as determined by the Historian). |
| Start Bound Not Found | If the starting bound is not found for the earliest interval and it is not partial, then what, if any, special processing should be done. |
| End Bound Not Found | If the ending bound is not found for the latest interval and it is not partial, then what, if any, special processing should be done. |
| Bound Bad | If the Bounding value is Bad, then what, if any, special processing should be done. |
| Bound Uncertain | If the Bounding value is uncertain, then what, if any, special processing should be done. |
5.4.3.4 Interpolative
The Interpolative Aggregate defined in Table 52 returns the Interpolated Bounding Value (see 3.1.8) for the startTime of each interval.
When searching for Good values before or after the bounding value, the time period searched is Server specific, but the Server should search a time range which is at least the size of the ProcessingInterval.
| Interpolated Aggregate Characteristics | |
| Type | Interpolated |
| Data Type | Same as Source |
| Use Bounds | Interpolated |
| Timestamp | StartTime |
| StatusCode Calculations | |
|---|---|
| Calculation Method | Custom Good if no Bad values skipped and Good values are used, Uncertain if Bad values skipped or if Uncertain values are used. If no starting value then Bad_NoData. See description of Interpolated Bounds (see 3.1.8) for more details |
| Partial bit | Not Set |
| Calculated bit | Not Set |
| Interpolated bit | Set Sometimes Always set except for when the Raw bit is set |
| Raw bit | Set Sometimes If a value exists with the exact time of interval Start |
| Multi Value bit | Not Set |
| StatusCode Common Special Cases | |
|---|---|
| Before Start of Data | Return Bad_NoData |
| After End of Data | Return extrapolated value (see 3.1.8) (sloped or stepped according to settings) Status code is Uncertain_DataSubNormal. |
| Start Bound Not Found | Bad_NoData. |
| End Bound Not Found | See “After End of Data” |
| Bound Bad | Does not return a Bad bound except as noted above |
| Bound Uncertain | Returned Uncertain_DataSubNormal if any Bad value(s) was/were skipped to calculate the bounding value. |
5.4.3.5 Average
The Average Aggregate defined in Table 53 adds up the values of all Good Raw data for each interval, and divides the sum by the number of Good values. If any non-Good values are ignored in the computation, the Aggregate StatusCode will be determined using the StatusCode Calculation (see 5.3). This Aggregate is not time based so the PercentGood/PercentBad applies to the number of values in the interval.
| Average Aggregate Characteristics | |
| Type | Calculated |
| Data Type | Double |
| Use Bounds | None |
| Timestamp | StartTime |
| StatusCode Calculations | |
|---|---|
| Calculation Method | PercentValues |
| Partial | Not Set |
| Calculated | Set Always |
| Interpolated | Not Set |
| Raw | Not Set |
| Multi Value | Not Set |
| StatusCode Common Special Cases | |
|---|---|
| Before Start of Data | Bad_NoData |
| After End of Data | Bad_NoData |
| No Start Bound | Bounds not used |
| No End Bound | Bounds not used |
| Bound Bad | Bounds not used |
| Bound Uncertain | Bounds not used |
5.4.3.6 TimeAverage
The TimeAverage Aggregate defined in Table 54 uses Interpolated Bounding Values (see 3.1.8) to find the value of a point at the beginning and end of an interval. Starting at the starting bounding value a straight line is drawn between each value in the interval ending at the ending bounding value (see examples for illustrations). The area under the lines is divided by the length of the ProcessingInterval to yield the average. Note that this calculation always uses a sloped line between points; TimeAverage2 uses a stepped or sloped line depending on the value of the Stepped Property for the Variable.
If one or more Bad Values exist in the interval then they are omitted from the calculation and the StatusCode is set to Uncertain_DataSubNormal. Sloped lines are drawn between the Good values when calculating the area.
The time resolution used in this calculation is Server specific.
| TimeAverage Aggregate Characteristics | |
| Type | Calculated |
| Data Type | Double |
| Use Bounds | Interpolated |
| Timestamp | StartTime |
| StatusCode Calculations | |
|---|---|
| Calculation Method | Custom Good if no Bad values skipped and Good values are used, Uncertain if Bad values are skipped or if Uncertain values are used |
| Partial | Set Sometimes If an interval is not a complete interval |
| Calculated | Set Always |
| Interpolated | Not Set |
| Raw | Not Set |
| Multi Value | Not Set |
| StatusCode Common Special Cases | |
|---|---|
| Before Start of Data | Bad_NoData |
| After End of Data | Value extrapolated, Uncertain status |
| No Start Bound | Calculate Partial Interval |
| No End Bound | Extrapolate data, Uncertain status |
| Bound Bad | NA |
| Bound Uncertain | NA |
5.4.3.7 TimeAverage2
The TimeAverage2 Aggregate defined in Table 55 uses Simple Bounding Values (see 3.1.9) to find the value of a point at the beginning and end of an interval. Starting at the starting bounding value a straight line is drawn between each value in the interval ending at the ending bounding value (see examples for illustrations). The area under the lines is divided by the length of the ProcessingInterval to yield the average. Note that this calculation uses a stepped or sloped line depending on what the value of the Stepped Property for the Variable; TimeAverage always uses a sloped line between points.
The time resolution used in this calculation is Server specific.
If any non-Good data exists in the interval, this data is omitted from the calculation and the time interval is reduced by the duration of the non-Good data; i.e. if a value was Bad for 1 minute in a 5-minute interval then the TimeAverage2 would be the area under the 4-minute period of Good values divided by 4 minutes. If a sub-interval ends at a Bad value then only the Good starting value is used to calculate the area of sub-interval preceding the Bad value.
The Aggregate StatusCode will be determined using the StatusCode Calculation (see 5.3).
| TimeAverage2 Aggregate Characteristics | |
| Type | Calculated |
| Data Type | Double |
| Use Bounds | Simple |
| Timestamp | StartTime |
| StatusCode Calculations | |
|---|---|
| Calculation Method | PercentTime |
| Partial | Set Sometimes If an interval is not a complete interval |
| Calculated | Set Always |
| Interpolated | Not Set |
| Raw | Not Set |
| Multi Value | Not Set |
| StatusCode Common Special Cases | |
|---|---|
| Before Start of Data | Bad_NoData |
| After End of Data | Bad_NoData |
| No Start Bound | Bound is Bad_NoData and treated as any other Bad value in the interval |
| No End Bound | Bound is Bad_NoData and treated as any other Bad value in the interval |
| Bound Bad | Treated as any other Bad value in the interval |
| Bound Uncertain | Treated as any other Uncertain value in the interval |
5.4.3.8 Total
The Total Aggregate defined in Table 56 performs the following calculation for each interval:
Total = TimeAverage x ProcessingInterval (seconds)
where: TimeAverage is the result from the TimeAverage Aggregate, using the ProcessingInterval supplied to the Total call.
The resulting units would be normalized to seconds, i.e. [TimeAverage Units] x seconds.
The Aggregate StatusCode will be determined using the StatusCode Calculation
(see 5.3).
Note that this calculation always uses a SlopedInterpolation between points; Total2 uses a Stepped Attribute or SlopedInterpolation depending on the value of the Stepped Attribute for the Variable.
| Total Aggregate Characteristics | ||
| Type | Calculated | |
| Data Type | Double | |
| Use Bounds | Interpolated | |
| Timestamp | StartTime | |
| StatusCode Calculations | ||
|---|---|---|
| Calculation Method | Custom Good if no Bad values are skipped and Good values are used, Uncertain if Bad values are skipped or if Uncertain values are used | |
| Partial | Set Sometimes If an interval is not a complete interval | |
| Calculated | Set Always | |
| Interpolated | Not Set | |
| Raw | Not Set | |
| Multi Value | Not Set | |
| StatusCode Common Special Cases | ||
|---|---|---|
| Before Start of Data | Bad_NoData | |
| After End of Data | Value extrapolated, Uncertain status | |
| No Start Bound | Calculate Partial Interval | |
| No End Bound | Extrapolate data, Uncertain status | |
| Bound Bad | NA | |
| Bound Uncertain | NA | |
5.4.3.9 Total2
The Total2 Aggregate defined in Table 57 performs the following calculation for each interval:
Total2 = TimeAverage2 x ProcessingInterval of Good data (seconds)
where TimeAverage2 is the result from the TimeAverage2 Aggregate, using the ProcessingInterval supplied to the Total2 call.
The interval of Good data is the sum of all sub-intervals where non-Bad data exists; i.e. if a value was Bad for 1 minute in a 5-minute interval then the interval of Good data would be the 4-minute period.
The resulting units would be normalized to seconds, i.e. [TimeAverage2 Units] x seconds.
The Aggregate StatusCode will be determined using the StatusCode Calculation
(see 5.3).
| Total2 Aggregate Characteristics | ||
| Type | Calculated | |
| Data Type | Double | |
| Use Bounds | Simple | |
| Timestamp | StartTime | |
| StatusCode Calculations | ||
|---|---|---|
| Calculation Method | PercentTime | |
| Partial | Set Sometimes If an interval is not a complete interval | |
| Calculated | Set Always | |
| Interpolated | Not Set | |
| Raw | Not Set | |
| Multi Value | Not Set | |
| StatusCode Common Special Cases | ||
|---|---|---|
| Before Start of Data | Bad_NoData | |
| After End of Data | Bad_NoData | |
| No Start Bound | Value for Bound is Bad_NoData and is treated like any other Bad quality value in the calculation (ignored) | |
| No End Bound | Value for Bound is Bad_NoData and is treated like any other Bad quality value in the calculation (ignored) | |
| Bound Bad | Value is treated like any other Bad quality value in the calculation (ignored) | |
| Bound Uncertain | Value is treated like any other non-Good quality value in the calculation (ignored) | |
5.4.3.10 Minimum
The Minimum Aggregate defined in Table 58 retrieves the minimum Good raw value within the interval, and returns that value with the timestamp at the start of the interval. Note that if the same minimum exists at more than one timestamp the MultipleValues bit is set.
Unless otherwise indicated, StatusCodes are Good, Calculated. If the minimum value is on the start time the status code will be Good, Raw. If only Bad quality values are available then the status is returned as Bad_NoData.
The timestamp of the Aggregate will always be the start of the interval for every ProcessingInterval.
| Minimum Aggregate Characteristics | ||
| Type | Calculated | |
| Data Type | Same as Source | |
| Use Bounds | None | |
| Timestamp | StartTime | |
| StatusCode Calculations | ||
|---|---|---|
| Calculation Method | Custom If no Bad values then the Status is Good. If Bad values exist then the Status is Uncertain_DataSubNormal. If an Uncertain value is less than the minimum Good value the Status is Uncertain_DataSubNormal. | |
| Partial | Set Sometimes If an interval is not a complete interval | |
| Calculated | Set Sometimes If the Minimum value is not on the StartTime of the interval or if the Status was set to Uncertain_DataSubNormal because of non-Good values in the interval | |
| Interpolated | Not Set | |
| Raw | Set Sometimes If Minimum value is on the StartTime of the interval | |
| Multi Value | Set Sometimes If multiple Good values exist with the Minimum value | |
| StatusCode Common Special Cases | ||
|---|---|---|
| Before Start of Data | Bad_NoData | |
| After End of Data | Bad_NoData | |
| No Start Bound | Not Applicable | |
| No End Bound | Not Applicable | |
| Bound Bad | Not Applicable | |
| Bound Uncertain | Not Applicable | |
5.4.3.11 Maximum
The Maximum Aggregate defined in Table 59 retrieves the maximum Good raw value within the interval, and returns that value with the timestamp at the start of the interval. Note that if the same maximum exists at more than one timestamp the MultipleValues bit is set.
Unless otherwise indicated, StatusCodes are Good, Calculated. If the maximum value is on the interval start time the status code will be Good, Raw. If only Bad quality values are available then the status is returned as Bad_NoData.
The timestamp of the Aggregate will always be the start of the interval for every ProcessingInterval.
| Maximum Aggregate Characteristics | ||
| Type | Calculated | |
| Data Type | Same as Source | |
| Use Bounds | None | |
| Timestamp | StartTime | |
| StatusCode Calculations | ||
|---|---|---|
| Calculation Method | Custom If no Bad values then the Status is Good. If Bad values exist then the Status is Uncertain_DataSubNormal. If an Uncertain value is greater than the maximum Good value the Status is Uncertain_DataSubNormal | |
| Partial | Set Sometimes If an interval is not a complete interval | |
| Calculated | Set Sometimes If the Maximum value is not on the startTime of the interval or if the Status was set to Uncertain_DataSubNormal because of non-Good values in the interval | |
| Interpolated | Not Set | |
| Raw | Set Sometimes If Maximum value is on the startTime of the interval | |
| Multi Value | Set Sometimes If multiple Good values exist with the Maximum value | |
| StatusCode Common Special Cases | ||
|---|---|---|
| Before Start of Data | Bad_NoData | |
| After End of Data | Bad_NoData | |
| No Start Bound | Not Applicable | |
| No End Bound | Not Applicable | |
| Bound Bad | Not Applicable | |
| Bound Uncertain | Not Applicable | |
5.4.3.12 MinimumActualTime
The MinimumActualTime Aggregate defined in Table 60 retrieves the minimum Good raw value within the interval, and returns that value with the timestamp at which that value occurs. Note that if the same minimum exists at more than one timestamp, the oldest one is retrieved and the Aggregate Bits are set to MultipleValues.
| MinimumActualTime Aggregate Characteristics | ||
| Type | Calculated | |
| Data Type | Same as Source | |
| Use Bounds | None | |
| Timestamp | Time of Minimum | |
| StatusCode Calculations | ||
|---|---|---|
| Calculation Method | Custom If no Bad values then the Status is Good. If Bad values exist then the Status is Uncertain_DataSubNormal. If an Uncertain value is less than the minimum Good value the Status is Uncertain_DataSubNormal | |
| Partial | Set Sometimes If an interval is not a complete interval | |
| Calculated | Set Sometimes If the Status was set to Uncertain_DataSubNormal because of non-Good values in the interval | |
| Interpolated | Not Set | |
| Raw | Set Sometimes If a Good minimum value is returned | |
| Multi Value | Set Sometimes If multiple Good values exist with the Minimum value | |
| StatusCode Common Special Cases | ||
|---|---|---|
| Before Start of Data | Bad_NoData | |
| After End of Data | Bad_NoData | |
| No Start Bound | Not Applicable | |
| No End Bound | Not Applicable | |
| Bound Bad | Not Applicable | |
| Bound Uncertain | Not Applicable | |
5.4.3.13 MaximumActualTime
The MaximumActualTime Aggregate defined in Table 61 is the same as the MinimumActualTime Aggregate, except that the value is the maximum raw value within the interval. Note that if the same maximum exists at more than one timestamp, the oldest one is retrieved and the Aggregate Bits are set to MultipleValues.
| MaximumActualTime Aggregate Characteristics | ||
| Type | Calculated | |
| Data Type | Same as Source | |
| Use Bounds | None | |
| Timestamp | Time of Maximum | |
| StatusCode Calculations | ||
|---|---|---|
| Calculation Method | Custom If no Bad values then the Status is Good. If Bad values exist then the Status is Uncertain_DataSubNormal. If an Uncertain value is greater than the maximum Good value the Status is Uncertain_DataSubNormal | |
| Partial | Set Sometimes If an interval is not a complete interval | |
| Calculated | Set Sometimes If the Status was set to Uncertain_DataSubNormal because of non-Good values in the interval | |
| Interpolated | Not Set | |
| Raw | Set Sometimes If a Good maximum value is returned | |
| Multi Value | Set Sometimes If multiple Good values exist with the maximum value | |
| StatusCode Common Special Cases | ||
|---|---|---|
| Before Start of Data | Bad_NoData | |
| After End of Data | Bad_NoData | |
| No Start Bound | Not Applicable | |
| No End Bound | Not Applicable | |
| Bound Bad | Not Applicable | |
| Bound Uncertain | Not Applicable | |
5.4.3.14 Range
The Range Aggregate defined in Table 62 finds the difference between the maximum and minimum Good raw values in the interval. If only one Good value exists in the interval, the range is zero. Note that the range is always zero or positive. If non-Good values are ignored when finding the minimum or maximum values or if Bad values exist then the status is Uncertain_DataSubNormal.
| Range Aggregate Characteristics | ||
| Type | Calculated | |
| Data Type | Same as Source | |
| Use Bounds | None | |
| Timestamp | StartTime | |
| StatusCode Calculations | ||
|---|---|---|
| Calculation Method | Custom If no Bad values then the Status is Good. If Bad values exist then the Status is Uncertain_DataSubNormal. If an Uncertain value is greater than the maximum or less than the minimum Good value the Status is Uncertain_DataSubNormal | |
| Partial | Set Sometimes If an interval is not a complete interval | |
| Calculated | Set Always | |
| Interpolated | Not Set | |
| Raw | Not Set | |
| Multi Value | Not Set | |
| StatusCode Common Special Cases | ||
|---|---|---|
| Before Start of Data | Bad_NoData | |
| After End of Data | Bad_NoData | |
| No Start Bound | Not Applicable | |
| No End Bound | Not Applicable | |
| Bound Bad | Not Applicable | |
| Bound Uncertain | Not Applicable | |
5.4.3.15 Minimum2
The Minimum2 Aggregate defined in Table 63 retrieves the minimum Good value for each interval as defined for Minimum except that Simple Bounding Values are included. The Simple Bounding Values for the interval are found according to the definition of Simple Bounding Values (see 3.1.9). Any Bad values are ignored in the computation. The Aggregate StatusCode will be determined using the StatusCode Calculation (see 5.3) for time based Aggregates. If a bounding value is returned then the status will indicate, Raw, Calculated or Interpolated.
If TreatUncertainAsBad is false and an Uncertain raw value is the minimum then that Uncertain value is used. Uncertain values are ignored otherwise.
If sloped interpolation is used and the End bound is the minimum value then End bound is used as the Minimum with the timestamp set to the startTime of the interval. The End bound is ignored in all other cases.
| Minimum2 Aggregate Characteristics | ||
| Type | Calculated | |
| Data Type | Same as Source | |
| Use Bounds | Simple | |
| Timestamp | StartTime | |
| StatusCode Calculations | ||
|---|---|---|
| Calculation Method | PercentTime | |
| Partial | Set Sometimes If an interval is not a complete interval | |
| Calculated | Set SometimesSet unless the StartBound is the Minimum | |
| Interpolated | Set Sometimes If an Interpolated bound is the Minimum | |
| Raw | Set Sometimes If a raw value is the Minimum. | |
| Multi Value | Set Sometimes If more than one Good values exist with the same | |
| StatusCode Common Special Cases | ||
|---|---|---|
| Before Start of Data | Bad_NoData | |
| After End of Data | Bad_NoData | |
| No Start Bound | Treat the beginning value as Bad_NoData and compute the Aggregate | |
| No End Bound | Treat the ending value as Bad_NoData and compute the Aggregate | |
| Bound Bad | Use as value and compute the Aggregate as defined | |
| Bound Uncertain | Use as value and compute the Aggregate as defined | |
5.4.3.16 Maximum2
The Maximum2 Aggregate defined in Table 64 retrieves the maximum Good value for each interval as defined for Maximum except that Simple Bounding Values are included. The Simple Bounding Values for the interval are found according to the definition of Simple Bounding Values (see 3.1.9). Any Bad values are ignored in the computation. The Aggregate StatusCode will be determined using the StatusCode Calculation (see 5.3) for time based Aggregates. If a bounding value is returned then the status will indicate, Raw, Calculated or Interpolated.
If TreatUncertainAsBad is false and an Uncertain raw value is the maximum then that Uncertain value is used. Uncertain values are ignored otherwise.
If sloped interpolation is used and the End bound is the maximum value then End bound is used as the maximum with the timestamp set to the startTime of the interval. The End bound is ignored in all other cases.
| Maximum2 Aggregate Characteristics | ||
| Type | Calculated | |
| Data Type | Same as Source | |
| Use Bounds | Simple | |
| Timestamp | StartTime | |
| StatusCode Calculations | ||
|---|---|---|
| Calculation Method | PercentTime | |
| Partial | Set Sometimes If an interval is not a complete interval | |
| Calculated | Set Sometimes Set unless the StartBound is the Maximum | |
| Interpolated | Set Sometimes If an Interpolated bound is the Maximum | |
| Raw | Set Sometimes If a raw value is the Maximum. | |
| Multi Value | Set Sometimes If more than one Good values exist with the same | |
| StatusCode Common Special Cases | ||
|---|---|---|
| Before Start of Data | Bad_NoData | |
| After End of Data | Bad_NoData | |
| No Start Bound | Treat the beginning value as Bad_NoData and compute the Aggregate | |
| No End Bound | Treat the ending value as Bad_NoData and compute the Aggregate | |
| Bound Bad | Use as value and compute the Aggregate as defined | |
| Bound Uncertain | Use as value and compute the Aggregate as defined | |
5.4.3.17 MinimumActualTime2
The MinimumActualTime2 Aggregate defined in Table 65 retrieves the minimum Good value for each interval as defined for MinimumActualTime except that Simple Bounding Values are included. The Simple Bounding Values for the interval are found according to the definition of Simple Bounding Values (see 3.1.9). Any Bad values are ignored in the computation. The Aggregate StatusCode will be determined using the StatusCode Calculation (see 5.3) for time based Aggregates. If a bounding value is returned then the status will indicate, Raw, Calculated or Interpolated.
If TreatUncertainAsBad is false and an Uncertain raw value is the minimum then that Uncertain value is used. Uncertain values are ignored otherwise.
If sloped interpolation is used and the End bound is the minimum value then End bound is used as the minimum with the timestamp set to the EffectiveEndTime of the interval. The End bound is ignored in all other cases.
| MinumumActualTime2 Aggregate Characteristics | ||
| Type | Calculated | |
| Data Type | Same as Source | |
| Use Bounds | Simple | |
| Timestamp | Time of minimum | |
| StatusCode Calculations | ||
|---|---|---|
| Calculation Method | PercentTime | |
| Partial | Set Sometimes If an interval is not a complete interval | |
| Calculated | Not Set | |
| Interpolated | Set Sometimes If an Interpolated bound is the Minimum | |
| Raw | Set Sometimes If a raw value is the Minimum | |
| Multi Value | Set Sometimes If more than one Good values exist with the same value | |
| StatusCode Common Special Cases | ||
|---|---|---|
| Before Start of Data | Bad_NoData | |
| After End of Data | Bad_NoData | |
| No Start Bound | Treat the beginning value as Bad_NoData and compute the Aggregate | |
| No End Bound | Treat the ending value as Bad_NoData and compute the Aggregate | |
| Bound Bad | Use as value and compute the Aggregate as defined | |
| Bound Uncertain | Use as value and compute the Aggregate as defined | |
5.4.3.18 MaximumActualTime2
The MaximumActualTime2 Aggregate defined in Table 66 retrieves the maximum Good value for each interval as defined for MaximumActualTime except that Simple Bounding Values are included. The Simple Bounding Values for the interval are found according to the definition of Simple Bounding Values (see 3.1.9). Any Bad values are ignored in the computation. The Aggregate StatusCode will be determined using the StatusCode Calculation (see 5.3) for time based Aggregates. If a bounding value is returned then the status will indicate, Raw, Calculated or Interpolated.
If TreatUncertainAsBad is false and an Uncertain raw value is the maximum then that Uncertain value is used. Uncertain values are ignored otherwise.
If sloped interpolation is used and the End bound is the maximum value then End bound is used as the maximum with the timestamp set to the EffectiveEndTime of the interval. The End bound is ignored in all other cases.
| MaximumActualTime2 Aggregate Characteristics | ||
| Type | Calculated | |
| Data Type | Same as Source | |
| Use Bounds | Simple | |
| Timestamp | Time of maximum | |
| StatusCode Calculations | ||
|---|---|---|
| Calculation Method | PercentTime | |
| Partial | Set Sometimes If an interval is not a complete interval | |
| Calculated | Not Set | |
| Interpolated | Set Sometimes If an Interpolated bound is the Maximum | |
| Raw | Set Sometimes If a raw value is the Maximum | |
| Multi Value | Set Sometimes If more than one value is equal to the Maximum | |
| StatusCode Common Special Cases | ||
|---|---|---|
| Before Start of Data | Bad_NoData | |
| After End of Data | Bad_NoData | |
| No Start Bound | Treat the beginning value as Bad_NoData and compute the Aggregate | |
| No End Bound | Treat the ending value as Bad_NoData and compute the Aggregate | |
| Bound Bad | Use as value and compute the Aggregate as defined | |
| Bound Uncertain | Use as value and compute the Aggregate as defined | |
5.4.3.19 Range2
The Range2 Aggregate defined in Table 67 finds the difference between the maximum and minimum values in the interval as returned by the Minimum2 and Maximum2 Aggregates. Note that the range is always zero or positive.
| Range2 Aggregate Characteristics | ||
| Type | Calculated | |
| Data Type | Same as Source | |
| Use Bounds | Simple (used in Minimum2 and Maximum2 calculations) | |
| Timestamp | StartTime | |
| StatusCode Calculations | ||
|---|---|---|
| Calculation Method | Custom If Minimum2 or Maximum2 are Bad then the status is Bad_NoData. If Minimum2 or Maximum2 are Uncertain then the status is Uncertain_DataSubNormal. Good otherwise | |
| Partial | Set Sometimes If an interval is not a complete interval | |
| Calculated | Set Always | |
| Interpolated | Not Set | |
| Raw | Not Set | |
| Multi Value | Not Set | |
| StatusCode Common Special Cases | ||
|---|---|---|
| Before Start of Data | Bad_NoData | |
| After End of Data | Bad_NoData | |
| No Start Bound | Handled by Minimum2 and Maximum2 | |
| No End Bound | Handled by Minimum2 and Maximum2 | |
| Bound Bad | Handled by Minimum2 and Maximum2 | |
| Bound Uncertain | Handled by Minimum2 and Maximum2 | |
5.4.3.20 AnnotationCount
The AnnotationCount Aggregate defined in Table 68 returns a count of all Annotations in the interval.
The StatusCodes are Good, Calculated.
| AnnotationCount Aggregate Characteristics | ||
| Type | Calculated | |
| Data Type | Int32 (negative values are not allowed) | |
| Use Bounds | None | |
| Timestamp | StartTime | |
| StatusCode Calculations | ||
|---|---|---|
| Calculation Method | Custom Good unless the interval is before the start of data or after the end of data | |
| Partial | Set Sometimes If an interval is not a complete interval | |
| Calculated | Set Always | |
| Interpolated | Not Set | |
| Raw | Not Set | |
| Multi Value | Not Set | |
| StatusCode Common Special Cases | ||
|---|---|---|
| Before Start of Data | Bad_NoData | |
| After End of Data | Bad_NoData | |
| No Start Bound | Does not apply | |
| No End Bound | Does not apply | |
| Bound Bad | Does not apply | |
| Bound Uncertain | Does not apply | |
5.4.3.21 Count
The Count Aggregate defined in Table 69 retrieves a count of all the raw values within an interval. If one or more raw values are non-Good, they are not included in the count, and the Aggregate StatusCode is determined using the StatusCode Calculation (see 5.4.3) for non-time based Aggregates. If no Good data exists for an interval, the count is zero.
Unless otherwise indicated, StatusCodes are Good, Calculated.
| Count Aggregate Characteristics | ||
| Type | Calculated | |
| Data Type | Int32 (negative values are not allowed) | |
| Use Bounds | None | |
| Timestamp | StartTime | |
| StatusCode Calculations | ||
|---|---|---|
| Calculation Method | PercentValues | |
| Partial | Set Sometimes If an interval is not a complete interval | |
| Calculated | Set Always | |
| Interpolated | Not Set | |
| Raw | Not Set | |
| Multi Value | Not Set | |
| StatusCode Common Special Cases | ||
|---|---|---|
| Before Start of Data | Bad_NoData | |
| After End of Data | Bad_NoData | |
| No Start Bound | Does not apply | |
| No End Bound | Does not apply | |
| Bound Bad | Does not apply | |
| Bound Uncertain | Does not apply | |
5.4.3.22 DurationInStateZero
The DurationInStateZero Aggregate defined in Table 70 returns the time Duration during the interval that the Variable was in the zero state. The Simple Bounding Values for the interval are used to determine initial value (start time < end time) or ending value (if start time > end time). If one or more raw values are non-Good, they are not included in the Duration, and the Aggregate StatusCode is determined using the StatusCode Calculation (see 5.3) for time based Aggregates. Duration is in milliseconds. Unless otherwise indicated, StatusCodes are Good, Calculated.
| DurationInStateZero Aggregate Characteristics | ||
| Type | Calculated | |
| Data Type | Duration | |
| Use Bounds | Simple | |
| Timestamp | StartTime | |
| StatusCode Calculations | ||
|---|---|---|
| Calculation Method | PercentTime | |
| Partial | Set Sometimes If an interval is not a complete interval | |
| Calculated | Set Always | |
| Interpolated | Not Set | |
| Raw | Not Set | |
| Multi Value | Not Set | |
| StatusCode Common Special Cases | ||
|---|---|---|
| Before Start of Data | Bad_NoData | |
| After End of Data | Bad_NoData | |
| No Start Bound | Treat the beginning value as Bad_NoData and compute the Aggregate | |
| No End Bound | Treat the ending value as Bad_NoData and compute the Aggregate | |
| Bound Bad | Use as value and compute the Aggregate as defined | |
| Bound Uncertain | Use as value and compute the Aggregate as defined | |
5.4.3.23 DurationInStateNonZero
The DurationInStateNonZero Aggregate defined in Table 71 returns the time Duration during the interval that the Variable was in the one state. The Simple Bounding Values for the interval are used to determine initial value (start time < end time) or ending value (if start time > end time). If one or more raw values are non-Good, they are not included in the Duration, and the Aggregate StatusCode is determined using the StatusCode Calculation (see 5.3) for time based Aggregates.
Duration is in milliseconds. Unless otherwise indicated, StatusCodes are Good, Calculated.
| DurationInStateNonZero Aggregate Characteristics | ||
| Type | Calculated | |
| Data Type | Duration | |
| Use Bounds | Simple | |
| Timestamp | StartTime | |
| StatusCode Calculations | ||
|---|---|---|
| Calculation Method | PercentTime | |
| Partial | Set Sometimes If an interval is not a complete interval | |
| Calculated | Set Always | |
| Interpolated | Not Set | |
| Raw | Not Set | |
| Multi Value | Not Set | |
| StatusCode Common Special Cases | ||
|---|---|---|
| Before Start of Data | Bad_NoData | |
| After End of Data | Bad_NoData | |
| No Start Bound | Treat the beginning value as Bad_NoData and compute the Aggregate | |
| No End Bound | Treat the ending value as Bad_NoData and compute the Aggregate | |
| Bound Bad | Use as value and compute the Aggregate as defined | |
| Bound Uncertain | Use as value and compute the Aggregate as defined | |
5.4.3.24 NumberOfTransitions
The NumberOfTransitions Aggregate defined in Table 72 returns a count of the number of transition the Variable had during the interval. If one or more raw values are Bad, they are not included in the count, and the Aggregate StatusCode is determined using the StatusCode Calculation (see 5.3) for non-time based Aggregates.
The earliest transition shall be calculated by comparing the earliest non-Bad value in the interval to the previous non-Bad value. A transition occurred if no previous non-Bad value exists or if the earliest non-Bad value is different. The endTime is not considered part of the interval, so a transition occurring at the endTime is not included.
Unless otherwise indicated, StatusCodes are Good, Calculated.
| NumberOfTransitions Aggregate Characteristics | ||
| Type | Calculated | |
| Data Type | Int32 (negative values are not allowed) | |
| Use Bounds | Custom, a non-Bad value prior to the interval is used | |
| Timestamp | StartTime | |
| StatusCode Calculations | ||
|---|---|---|
| Calculation Method | PercentValues | |
| Partial | Set Sometimes If an interval is not a complete interval | |
| Calculated | Set Always | |
| Interpolated | Not Set | |
| Raw | Not Set | |
| Multi Value | Not Set | |
| StatusCode Common Special Cases | ||
|---|---|---|
| Before Start of Data | Bad_NoData | |
| After End of Data | Bad_NoData | |
| No Start Bound | Treat the beginning value as Bad_NoData and compute the Aggregate | |
| No End Bound | Treat the ending value as Bad_NoData and compute the Aggregate | |
| Bound Bad | Use as value and compute the Aggregate as defined | |
| Bound Uncertain | Use as value and compute the Aggregate as defined | |
5.4.3.25 Start
The Start Aggregate defined in Table 73 retrieves the earliest raw value within the interval, and returns that value and status with the timestamp at which that value occurs. If no values are in the interval then the StatusCode is Bad_NoData.
| Start Aggregate Characteristics | ||
| Type | Calculated | |
| Data Type | Same as Source | |
| Use Bounds | None | |
| Timestamp | Time of Raw Value | |
| StatusCode Calculations | ||
|---|---|---|
| Calculation Method | Custom The raw value status is returned | |
| Partial | Set Sometimes If an interval is not a complete interval | |
| Calculated | Not Set | |
| Interpolated | Not Set | |
| Raw | Always | |
| Multi Value | Not Set | |
| StatusCode Common Special Cases | ||
|---|---|---|
| Before Start of Data | Bad_NoData | |
| After End of Data | Bad_NoData | |
| No Start Bound | Does not apply | |
| No End Bound | Does not apply | |
| Bound Bad | Does not apply | |
| Bound Uncertain | Does not apply | |
5.4.3.26 End
The End Aggregate defined in Table 74 retrieves the latest raw value within the interval, and returns that value and status with the timestamp at which that value occurs. If no values are in the interval then the StatusCode is Bad_NoData.
| End Aggregate Characteristics | ||
| Type | Calculated | |
| Data Type | Same as Source | |
| Use Bounds | None | |
| Timestamp | Time of Raw Value | |
| StatusCode Calculations | ||
|---|---|---|
| Calculation Method | Custom The raw value status is returned | |
| Partial | Set Sometimes If an interval is not a complete interval | |
| Calculated | Not Set | |
| Interpolated | Not Set | |
| Raw | Always | |
| Multi Value | Not Set | |
| StatusCode Common Special Cases | ||
|---|---|---|
| Before Start of Data | Bad_NoData | |
| After End of Data | Bad_NoData | |
| No Start Bound | Does not apply | |
| No End Bound | Does not apply | |
| Bound Bad | Does not apply | |
| Bound Uncertain | Does not apply | |
5.4.3.27 Delta
The Delta Aggregate defined in Table 75 retrieves the difference between the earliest and latest Good raw values in the interval. The Aggregate is negative if the latest value is less than the earliest value. The status is Uncertain_DataSubNormal if non-Good values are skipped while looking for the first or last values. The status is Good otherwise. The status is Bad_NoData if no Good raw values exist.
| Delta Aggregate Characteristics | ||
| Type | Calculated | |
| Data Type | Same as Source | |
| Use Bounds | None | |
| Timestamp | StartTime | |
| StatusCode Calculations | ||
|---|---|---|
| Calculation Method | Custom Uncertain_DataSubNormal if non-Good values are skipped while looking for the first or last values | |
| Partial | Set Sometimes If an interval is not a complete interval | |
| Calculated | Set Always | |
| Interpolated | Not Set | |
| Raw | Not Set | |
| Multi Value | Not Set | |
| StatusCode Common Special Cases | ||
|---|---|---|
| Before Start of Data | Bad_NoData | |
| After End of Data | Bad_NoData | |
| No Start Bound | Does not apply | |
| No End Bound | Does not apply | |
| Bound Bad | Does not apply | |
| Bound Uncertain | Does not apply | |
5.4.3.28 StartBound
The StartBound Aggregate defined in Table 76 returns the value and status at the StartTime for the interval by calculating the Simple Bounding Values for the interval (see 3.1.9).
| StartBound Aggregate Characteristics | ||
| Type | Calculated | |
| Data Type | Same as Source | |
| Use Bounds | Simple | |
| Timestamp | StartTime | |
| StatusCode Calculations | ||
|---|---|---|
| Calculation Method | Custom The status of the start bound. | |
| Partial | Set Sometimes If an interval is not a complete interval | |
| Calculated | Not Set | |
| Interpolated | Set Sometimes If the bound is interpolated | |
| Raw | Set Sometimes If a value exists at the start time | |
| Multi Value | Not Set | |
| StatusCode Common Special Cases | ||
|---|---|---|
| Before Start of Data | Bad_NoData | |
| After End of Data | Bad_NoData | |
| No Start Bound | Bad_NoData | |
| No End Bound | Does not apply | |
| Bound Bad | Same as bound | |
| Bound Uncertain | Same as bound | |
5.4.3.29 EndBound
The EndBound Aggregate defined in Table 77 returns the value and status at the EndTime for the interval by calculating the Simple Bounding Values for the interval (see 3.1.9).
The timestamp returned is always the start of the interval and Calculated bit is set.
| EndBound Aggregate Characteristics | ||
| Type | Calculated | |
| Data Type | Same as Source | |
| Use Bounds | Simple | |
| Timestamp | StartTime | |
| StatusCode Calculations | ||
|---|---|---|
| Calculation Method | Custom The status of the end bound. | |
| Partial | Set Sometimes If an interval is not a complete interval | |
| Calculated | Set Always | |
| Interpolated | Not Set | |
| Raw | Not Set | |
| Multi Value | Not Set | |
| StatusCode Common Special Cases | ||
|---|---|---|
| Before Start of Data | Bad_NoData | |
| After End of Data | Bad_NoData | |
| No Start Bound | Does not apply | |
| No End Bound | Bad_NoData | |
| Bound Bad | Same as bound | |
| Bound Uncertain | Same as bound | |
5.4.3.30 DeltaBounds
The DeltaBounds Aggregate defined in Table 78 returns the difference between the StartBound and the EndBound Aggregates with the exception that both the start and end shall be Good. If the end value is less than the start value, the result will be negative. If the end value is the same as the start value the result will be zero. If the end value is greater than the start value, the result will be positive. If one or both values are Bad the return status will be Bad_NoData. If one or both values are Uncertain the status will be Uncertain_DataSubNormal.
| DeltaBounds Aggregate Characteristics | ||
| Type | Calculated | |
| Data Type | Same as Source | |
| Use Bounds | Simple | |
| Timestamp | StartTime | |
| StatusCode Calculations | ||
|---|---|---|
| Calculation Method | Custom Good if both bounds are Good Uncertain_DataSubNormal if either bound is uncertain Bad_NoData if either bound is Bad | |
| Partial | Set Sometimes If an interval is not a complete interval | |
| Calculated | Set Always | |
| Interpolated | Not Set | |
| Raw | Not Set | |
| Multi Value | Not Set | |
| StatusCode Common Special Cases | ||
|---|---|---|
| Before Start of Data | Bad_NoData | |
| After End of Data | Bad_NoData | |
| No Start Bound | Bad_NoData | |
| No End Bound | Bad_NoData | |
| Bound Bad | Bad_NoData | |
| Bound Uncertain | Uncertain_DataSubNormal | |
5.4.3.31 DurationGood
The DurationGood Aggregate defined in Table 79 divides the interval into regions of Good and non-Good data. Each region starts with a data point in the interval. If that data point is Good the region is Good. The Aggregate is the sum of the duration of all Good regions expressed in milliseconds.
The status of the first region is determined by finding the first data point at or before the start of the interval. If no value exists, the first region is Bad.
Each Aggregate is returned with timestamp of the start of the interval. StatusCodes are Good, Calculated.
| DurationGood Aggregate Characteristics | ||
| Type | Calculated | |
| Data Type | Duration | |
| Use Bounds | Uses status of bounding value | |
| Timestamp | StartTime | |
| StatusCode Calculations | ||
|---|---|---|
| Calculation Method | Custom StatusCode is always Good, Calculated | |
| Partial | Set Sometimes If an interval is not a complete interval | |
| Calculated | Set Always | |
| Interpolated | Not Set | |
| Raw | Not Set | |
| Multi Value | Not Set | |
| StatusCode Common Special Cases | ||
|---|---|---|
| Before Start of Data | Bad_NoData | |
| After End of Data | Bad_NoData | |
| No Start Bound | No special handing required | |
| No End Bound | No special handing required | |
| Bound Bad | No special handing required | |
| Bound Uncertain | No special handing required | |
5.4.3.32 DurationBad
The DurationBad Aggregate defined in Table 80 divides the interval into regions of Bad and non-Bad data. Each region starts with a data point in the interval. If that data point is Bad the region is Bad. The Aggregate is the sum of the duration of all Bad regions expressed in milliseconds.
The status of the first region is determined by finding the first data point at or before the start of the interval. If no value exists, the first region is Bad.
Each Aggregate is returned with timestamp of the start of the interval. StatusCodes are Good, Calculated.
| DurationBad Aggregate Characteristics | ||
| Type | Calculated | |
| Data Type | Duration | |
| Use Bounds | Uses status of bounding value | |
| Timestamp | StartTime | |
| StatusCode Calculations | ||
|---|---|---|
| Calculation Method | Custom StatusCode is always Good, Calculated | |
| Partial | Set Sometimes If an interval is not a complete interval | |
| Calculated | Set Always | |
| Interpolated | Not Set | |
| Raw | Not Set | |
| Multi Value | Not Set | |
| StatusCode Common Special Cases | ||
|---|---|---|
| Before Start of Data | Bad_NoData | |
| After End of Data | Bad_NoData | |
| No Start Bound | No special handing required | |
| No End Bound | No special handing required | |
| Bound Bad | No special handing required | |
| Bound Uncertain | No special handing required | |
5.4.3.33 PercentGood
The PercentGood Aggregate defined in Table 81 performs the following calculation:
PercentGood = DurationGood / ProcessingInterval x 100
where:
DurationGood is the result from the DurationGood Aggregate, calculated using the ProcessingInterval supplied to PercentGood call.
ProcessingInterval is the duration of interval.
If the last interval is a partial interval then the duration of the partial interval is used in the calculation. Each Aggregate is returned with timestamp of the start of the interval. StatusCodes are Good, Calculated.
| PercentGood Aggregate Characteristics | ||
| Type | Calculated | |
| Data Type | Double (percent) | |
| Use Bounds | Simple (used in DurationGood calculation) | |
| Timestamp | StartTime | |
| StatusCode Calculations | ||
|---|---|---|
| Calculation Method | Custom Always Good | |
| Partial | Set Sometimes If an interval is not a complete interval | |
| Calculated | Set Always | |
| Interpolated | Not Set | |
| Raw | Not Set | |
| Multi Value | Not Set | |
| StatusCode Common Special Cases | ||
|---|---|---|
| Before Start of Data | Bad_NoData | |
| After End of Data | Bad_NoData | |
| No Start Bound | No special handing required | |
| No End Bound | No special handing required | |
| Bound Bad | No special handing required | |
| Bound Uncertain | No special handing required | |
5.4.3.34 PercentBad
The PercentBad Aggregate defined in Table 82 performs the following calculation:
PercentBad = DurationBad / ProcessingInterval x 100
where:
DurationBad is the result from the DurationBad Aggregate, calculated using the ProcessingInterval supplied to PercentBad call.
ProcessingInterval is the duration of interval.
If the last interval is a partial interval then the duration of the partial interval is used in the calculation. Each Aggregate is returned with timestamp of the start of the interval. StatusCodes are Good, Calculated.
| PercentBad Aggregate Characteristics | ||
| Type | Calculated | |
| Data Type | Double (percent) | |
| Use Bounds | Simple (used in DurationBad calculation) | |
| Timestamp | StartTime | |
| StatusCode Calculations | ||
|---|---|---|
| Calculation Method | Custom Always Good. | |
| Partial | Set Sometimes If an interval is not a complete interval | |
| Calculated | Set Always | |
| Interpolated | Not Set | |
| Raw | Not Set | |
| Multi Value | Not Set | |
| StatusCode Common Special Cases | ||
|---|---|---|
| Before Start of Data | Bad_NoData | |
| After End of Data | Bad_NoData | |
| No Start Bound | No special handing required | |
| No End Bound | No special handing required | |
| Bound Bad | No special handing required | |
| Bound Uncertain | No special handing required | |
5.4.3.35 WorstQuality
The WorstQuality Aggregate defined in Table 83 returns the worst status of the raw values in the interval where a Bad status is worse than Uncertain, which is worse than Good. No distinction is made between the specific reasons for the status. The server shall ignore the TreatUncertainAsBad for this aggregate.
If multiple values exist with the worst quality the MultipleValues bit is set. If multiple values exist with the worst quality but different StatusCodes then the StatusCode of the first value is returned.
This Aggregate returns the worst StatusCode as the value of the Aggregate.
The timestamp is always the start of the interval. The StatusCodes are Good, Calculated.
| WorstQuality Aggregate Characteristics | ||
| Type | Calculated | |
| Data Type | StatusCode | |
| Use Bounds | None | |
| Timestamp | StartTime | |
| StatusCode Calculations | ||
|---|---|---|
| Calculation Method | Custom Always Good | |
| Partial | Set Sometimes If an interval is not a complete interval | |
| Calculated | Set Always | |
| Interpolated | Not Set | |
| Raw | Not Set | |
| Multi Value | Used | |
| StatusCode Common Special Cases | ||
|---|---|---|
| Before Start of Data | Bad_NoData | |
| After End of Data | Bad_NoData | |
| No Start Bound | No special handing required | |
| No End Bound | No special handing required | |
| Bound Bad | No special handing required | |
| Bound Uncertain | No special handing required | |
5.4.3.36 WorstQuality2
The WorstQuality2 Aggregate defined in Table 84 returns the worst status of the raw values in the interval where a Bad status is worse than Uncertain, which is worse than Good. No distinction is made between the specific reasons for the status. The server shall ignore the TreatUncertainAsBad for this aggregate.
The start bound calculated using Simple Bounding Values (see 3.1.9) is always included when determining the worst quality.
If multiple values exist with the worst quality the MultipleValues bit is set. If multiple values exist with the worst quality but different StatusCodes then the StatusCode of the first value is returned.
This Aggregate returns the worst StatusCode as the value of the Aggregate.
The timestamp is always the start of the interval. The StatusCodes are Good, Calculated.
| WorstQuality2 Aggregate Characteristics | ||
| Type | Calculated | |
| Data Type | StatusCode | |
| Use Bounds | Simple | |
| Timestamp | StartTime | |
| StatusCode Calculations | ||
|---|---|---|
| Calculation Method | Custom Always Good | |
| Partial | Set Sometimes If an interval is not a complete interval | |
| Calculated | Set Always | |
| Interpolated | Not Set | |
| Raw | Not Set | |
| Multi Value | Used | |
| StatusCode Common Special Cases | ||
|---|---|---|
| Before Start of Data | Bad_NoData | |
| After End of Data | Bad_NoData | |
| No Start Bound | No special handing required | |
| No End Bound | No special handing required | |
| Bound Bad | No special handing required | |
| Bound Uncertain | No special handing required | |
5.4.3.37 StandardDeviationSample
The StandardDeviationSample Aggregate defined in Table 85 uses the formula:
where X is each Good raw value in the interval, Avg(X) is the average of the Good raw values, and n is the number of Good raw values in the interval.
For every interval where n = 1, a value of 0 is returned.
If any non-Good values were ignored, the Aggregate quality is uncertain/subnormal.
All interval Aggregates return timestamp of the start of the interval. Unless otherwise indicated, qualities are Good, Calculated.
This calculation is for a sample population where the calculation is done on a subset of the full set of data. Use StandardDeviationPopulation to calculate the standard deviation of a full set of data (see 5.4.3.39). An example would be when the underlying data is sampled from the data source versus stored on an exception basis.
| StandardDeviationSample Aggregate Characteristics | ||
| Type | Calculated | |
| Data Type | Double | |
| Use Bounds | None | |
| Timestamp | StartTime | |
| StatusCode Calculations | ||
|---|---|---|
| Calculation Method | Custom Always Good | |
| Partial | Set Sometimes If an interval is not a complete interval | |
| Calculated | Set Always | |
| Interpolated | Not Set | |
| Raw | Not Set | |
| Multi Value | Not Set | |
| StatusCode Common Special Cases | ||
|---|---|---|
| Before Start of Data | Bad_NoData | |
| After End of Data | Bad_NoData | |
| No Start Bound | No special handing required | |
| No End Bound | No special handing required | |
| Bound Bad | No special handing required | |
| Bound Uncertain | No special handing required | |
5.4.3.38 VarianceSample
The VarianceSample Aggregate defined in Table 86 retrieves the square of the standard deviation. Its behaviour is the same as the StandardDeviationSample Aggregate. Unless otherwise indicated, qualities are Good, Calculated.
This calculation is for a sample population where the calculation is done on a subset of the full population. Use VariancePopulation to calculate the variance of a full set of data (5.4.3.40).
| VarianceSample Aggregate Characteristics | ||
| Type | Calculated | |
| Data Type | Double | |
| Use Bounds | None | |
| Timestamp | StartTime | |
| StatusCode Calculations | ||
|---|---|---|
| Calculation Method | Custom Always Good | |
| Partial | Set Sometimes If an interval is not a complete interval | |
| Calculated | Set Always | |
| Interpolated | Not Set | |
| Raw | Not Set | |
| Multi Value | Not Set | |
| StatusCode Common Special Cases | ||
|---|---|---|
| Before Start of Data | Bad_NoData | |
| After End of Data | Bad_NoData | |
| No Start Bound | No special handing required | |
| No End Bound | No special handing required | |
| Bound Bad | No special handing required | |
| Bound Uncertain | No special handing required | |
5.4.3.39 StandardDeviationPopulation
The StandardDeviationPopulation Aggregate defined in Table 87 uses the formula:
where X is each Good raw value in the interval, Avg(X) is the average of the Good raw values, and n is the number of Good raw values in the interval.
For every interval where n = 1, a value of 0 is returned.
If any non-Good values were ignored, the Aggregate quality is uncertain/subnormal.
All interval Aggregates return timestamp of the start of the interval. Unless otherwise indicated, qualities are Good, Calculated.
This calculation is for a full population where the calculation is done on the full set of data. Use StandardDeviationSample to calculate the standard deviation of a subset of the full population (5.4.3.37). An example would be when the underlying data is collected on an exception basis versus sampled from the data source.
| StandardDeviationPopulation Aggregate Characteristics | ||
| Type | Calculated | |
| Data Type | Double | |
| Use Bounds | None | |
| Timestamp | StartTime | |
| StatusCode Calculations | ||
|---|---|---|
| Calculation Method | Custom Always Good | |
| Partial | Set Sometimes If an interval is not a complete interval | |
| Calculated | Set Always | |
| Interpolated | Not Set | |
| Raw | Not Set | |
| Multi Value | Not Set | |
| StatusCode Common Special Cases | ||
|---|---|---|
| Before Start of Data | Bad_NoData | |
| After End of Data | Bad_NoData | |
| No Start Bound | No special handing required | |
| No End Bound | No special handing required | |
| Bound Bad | No special handing required | |
| Bound Uncertain | No special handing required | |
5.4.3.40 VariancePopulation
The VariancePopulation Aggregate defined in Table 88 retrieves the square of the standard deviation. Its behaviour is the same as the StandardDeviationPopulation Aggregate. Unless otherwise indicated, qualities are Good, Calculated.
This calculation is for a full population where the calculation is done on the full set of data. Use VarianceSample to calculate the variance of a subset of the full population (5.4.3.38).
| VariancePopulation Aggregate Characteristics | ||
| Type | Calculated | |
| Data Type | Double | |
| Use Bounds | None | |
| Timestamp | StartTime | |
| StatusCode Calculations | ||
|---|---|---|
| Calculation Method | Custom Always Good | |
| Partial | Set Sometimes If an interval is not a complete interval | |
| Calculated | Set Always | |
| Interpolated | Not Set | |
| Raw | Not Set | |
| Multi Value | Not Set | |
| StatusCode Common Special Cases | ||
|---|---|---|
| Before Start of Data | Bad_NoData | |
| After End of Data | Bad_NoData | |
| No Start Bound | No special handing required | |
| No End Bound | No special handing required | |
| Bound Bad | No special handing required | |
| Bound Uncertain | No special handing required | |