4 Aggregate information model
4.1 General
OPC 10000-3 and OPC 10000-5 standards define the representation of Aggregate historical or buffered real time data in the OPC Unified Architecture. This includes the definition of Aggregates used in processed data retrieval and in historical retrieval. This definition includes both standard Reference types and Object types.
4.2 Aggregate Objects
4.2.1 General
4.2.1.1 Overview
OPC UA Servers can support several different functionalities and capabilities. The following standard Objects are used to expose these capabilities in a common fashion, and there are several standard defined concepts that can be extended by vendors.
4.2.1.2 AggregateConfigurationType
The AggregateConfigurationType defines the general characteristics of a Node that defines the Aggregate configuration of any Variable or Property. AggregateConfiguration Object represents the browse entry point for information on how the Server treats Aggregate specific functionality such as handling Uncertain data. It is formally defined in Table 2.
| Attribute | Value | ||||
| BrowseName | AggregateConfigurationType | ||||
| IsAbstract | False | ||||
| References | NodeClass | BrowseName | DataType | TypeDefinition | ModellingRule |
|---|---|---|---|---|---|
| Subtype of the BaseObjectType defined in OPC 10000-5 | |||||
| HasProperty | Variable | TreatUncertainAsBad | Boolean | PropertyType | Mandatory |
| HasProperty | Variable | PercentDataBad | Byte | PropertyType | Mandatory |
| HasProperty | Variable | PercentDataGood | Byte | PropertyType | Mandatory |
| HasProperty | Variable | UseSlopedExtrapolation | Boolean | PropertyType | Mandatory |
| Conformance Units | |||||
|---|---|---|---|---|---|
| Aggregate Master Configuration |
The TreatUncertainAsBad Variable indicates how the Server treats data returned with a StatusCode severity Uncertain with respect to Aggregate calculations. A value of True indicates the Server considers the severity equivalent to Bad, a value of False indicates the Server considers the severity equivalent to Good, unless the Aggregate definition says otherwise. The default value is True. Note that the value is still treated as Uncertain when the StatusCode for the result is calculated.
The PercentDataBad Variable indicates the minimum percentage of Bad data in a given interval required for the StatusCode for the given interval for processed data request to be set to Bad. (Uncertain is treated as defined above.) Refer to 5.4.3 for details on using this Variable when assigning StatusCodes. For details on which Aggregates use the PercentDataBad Variable, see the definition of each Aggregate. The default value is 100.
The PercentDataGood Variable indicates the minimum percentage of Good data in a given interval required for the StatusCode for the given interval for the processed data requests to be set to Good. Refer to 5.4.3 for details on using this Variable when assigning StatusCodes. For details on which Aggregates use the PercentDataGood Variable, see the definition of each Aggregate. The default value is 100.
The following calculations are used to detemine the StatusCode which will be used to calculate the value of the aggregate. Refer to 5.4.3 for details on using these Variables when assigning StatusCodes. The PercentDataGood and PercentDataBad shall follow the following relationship PercentDataGood ≥ (100 – PercentDataBad). If they are equal the result of the PercentDataGood calculation is used. If the values entered for PercentDataGood and PercentDataBad do not result in a valid calculation (e.g. Bad = 80; Good = 0) the result will have a StatusCode of Bad_AggregateInvalidInputs The StatusCode Bad_AggregateInvalidInputs will be returned if the value of PercentDataGood or PercentDataBad exceed 100.
The UseSlopedExtrapolation Variable indicates how the Server interpolates data when no boundary value exists (i.e. extrapolating into the future from the last known value). A value of False indicates that the Server will use a SteppedExtrapolation format, and hold the last known value constant. A value of True indicates the Server will project the value using UseSlopedExtrapolation mode. The default value is False. For SimpleBounds this value is ignored.
4.2.2 AggregateFunction Object
4.2.2.1 General
This Object is used as the browse entry point for information about the Aggregates supported by a Server. The content of this Object is already defined by its type definition. All Instances of the FolderType use the standard BrowseName of ‘AggregateFunctions’. The HasComponent Reference is used to relate a ServerCapabilities Object and/or any HistoryServerCapabilitiesType Object to an AggregateFunction Object. AggregateFunctions is formally defined in Table 3.
| Attribute | Value | |||||
| BrowseName | AggregateFunctions | |||||
| References | Node Class | BrowseName | DataType | TypeDefinition | ModellingRule | |
|---|---|---|---|---|---|---|
| HasTypeDefinition | Object Type | FolderType | Defined in OPC 10000-5 | |||
| Conformance Units | ||||||
|---|---|---|---|---|---|---|
| Historical Access Aggregates |
Each ServerCapabilities and HistoryServerCapabilitiesType Object shall reference an AggregateFunction Object. In addition, each HistoricalConfiguration Object belonging to a HistoricalDataNode may reference an AggregateFunction Object using the HasComponent Reference.
4.2.2.2 AggregateFunctionType
This ObjectType defines an Aggregate supported by a UA Server. This Object is formally defined in Table 4.
| Attribute | Value | ||||
| BrowseName | AggregateFunctionType | ||||
| IsAbstract | False | ||||
| References | Node Class | BrowseName | DataType |
Type
Definition |
Mod.
Rule |
|---|---|---|---|---|---|
| Subtype of the BaseObjectType defined in OPC 10000-5 | |||||
| Conformance Units | |||||
|---|---|---|---|---|---|
| Historical Access Aggregates |
For the AggregateFunctionType, the Description Attribute (inherited from the Base NodeClass), is mandatory. The Description Attribute provides a localized description of the Aggregate.
Table 5 specifies the BrowseName and Description Attributes for the standard Aggregate Objects. The description is the localized “en” text. For other locales it shall be translated.
| BrowseName | Description |
|---|---|
| Interpolative | At the beginning of each interval, retrieve the calculated value from the data points on either side of the requested timestamp. |
| Average | Retrieve the average value of the data over the interval. |
| TimeAverage | Retrieve the time weighted average data over the interval using Interpolated Bounding Values. |
| TimeAverage2 | Retrieve the time weighted average data over the interval using Simple Bounding Values. |
| Total | Retrieve the total (time integral) of the data over the interval using Interpolated Bounding Values. |
| Total2 | Retrieve the total (time integral) of the data over the interval using Simple Bounding Values. |
| Minimum | Retrieve the minimum raw value in the interval with the timestamp of the start of the interval. |
| Maximum | Retrieve the maximum raw value in the interval with the timestamp of the start of the interval. |
| MinimumActualTime | Retrieve the minimum value in the interval and the timestamp of the minimum value. |
| MaximumActualTime | Retrieve the maximum value in the interval and the timestamp of the maximum value. |
| Range | Retrieve the difference between the minimum and maximum value over the interval. |
| Minimum2 | Retrieve the minimum value in the interval including the Simple Bounding Values. |
| Maximum2 | Retrieve the maximum value in the interval including the Simple Bounding Values. |
| MinimumActualTime2 | Retrieve the minimum value with the actual timestamp including the Simple Bounding Values. |
| MaximumActualTime2 | Retrieve the maximum value with the actual timestamp including the Simple Bounding Values. |
| Range2 | Retrieve the difference between the Minimum2 and Maximum2 value over the interval. |
| Count | Retrieve the number of raw values over the interval. |
| DurationInStateZero | Retrieve the time a Boolean or numeric was in a zero state using Simple Bounding Values. |
| DurationInStateNonZero | Retrieve the time a Boolean or numeric was in a non-zero state using Simple Bounding Values. |
| NumberOfTransitions | Retrieve the number of changes between zero and non-zero that a Boolean or numeric value experienced in the interval. |
| Start | Retrieve the value at the beginning of the interval. |
| End | Retrieve the value at the end of the interval. |
| Delta | Retrieve the difference between the Start and End value in the interval. |
| StartBound | Retrieve the value at the beginning of the interval using Simple Bounding Values. |
| EndBound | Retrieve the value at the end of the interval using Simple Bounding Values. |
| DeltaBounds | Retrieve the difference between the StartBound and EndBound value in the interval using Simple Bounding Values. |
| DurationGood | Retrieve the total duration of time in the interval during which the data is Good. |
| DurationBad | Retrieve the total duration of time in the interval during which the data is Bad. |
| PercentGood | Retrieve the percentage of data (0 to 100) in the interval which has Good StatusCode. |
| PercentBad | Retrieve the percentage of data (0 to 100) in the interval which has Bad StatusCode. |
| WorstQuality | Retrieve the worst StatusCode of data in the interval. |
| WorstQuality2 | Retrieve the worst StatusCode of data in the interval including the Simple Bounding Values. |
| AnnotationCount | Retrieve the number of Annotations in the interval (applies to Historical Aggregates only). |
| StandardDeviationSample | Retrieve the standard deviation for the interval for a sample of the population (n-1). |
| VarianceSample | Retrieve the variance for the interval as calculated by the StandardDeviationSample. |
| StandardDeviationPopulation | Retrieve the standard deviation for the interval for a complete population (n) which includes Simple Bounding Values. |
| VariancePopulation | Retrieve the variance for the interval as calculated by the StandardDeviationPopulation which includes Simple Bounding Values. |
4.2.2.3 Interpolative Aggregate Object
The Interpolative Aggregate Object is an instance of AggregateFunctionType and represents the interpolative aggregate function defined in 5.4.3.4. See Table 8 for details.
| Attribute | Value | |||||
| BrowseName | Interpolative | |||||
| References | Node Class | BrowseName | DataType | TypeDefinition | ModellingRule | |
|---|---|---|---|---|---|---|
| HasTypeDefinition | Object Type | AggregateFunctionType | ||||
| Conformance Units | ||||||
|---|---|---|---|---|---|---|
| Aggregates - Interpolative |
4.2.2.4 Average Aggregate Object
The Average Aggregate Object is an instance of AggregateFunctionType and represents the average aggregate function defined in 5.4.3.5. See Table 7 for details.
| Attribute | Value | |||||
| BrowseName | Average | |||||
| References | Node Class | BrowseName | DataType | TypeDefinition | ModellingRule | |
|---|---|---|---|---|---|---|
| HasTypeDefinition | Object Type | AggregateFunctionType | ||||
| Conformance Units | ||||||
|---|---|---|---|---|---|---|
| Aggregates - Average |
4.2.2.5 TimeAverage Aggregate Object
The TimeAverage Aggregate Object is an instance of AggregateFunctionType and represents the time average aggregate function defined in 5.4.3.6. See Table 8 for details.
| Attribute | Value | |||||
| BrowseName | TimeAverage | |||||
| References | Node Class | BrowseName | DataType | TypeDefinition | ModellingRule | |
|---|---|---|---|---|---|---|
| HasTypeDefinition | Object Type | AggregateFunctionType | ||||
| Conformance Units | ||||||
|---|---|---|---|---|---|---|
| Aggregates - TimeAverage |
4.2.2.6 TimeAverage2 Aggregate Object
The TimeAverage2 Aggregate Object is an instance of AggregateFunctionType and represents the time average 2 aggregate function defined in 5.4.3.7. See Table 9 for details.
| Attribute | Value | |||||
| BrowseName | TimeAverage2 | |||||
| References | Node Class | BrowseName | DataType | TypeDefinition | ModellingRule | |
|---|---|---|---|---|---|---|
| HasTypeDefinition | Object Type | AggregateFunctionType | ||||
| Conformance Units | ||||||
|---|---|---|---|---|---|---|
| Aggregates - TimeAverage2 |
4.2.2.7 Total Aggregate Object
The Total Aggregate Object is an instance of AggregateFunctionType and represents the total aggregate function defined in 5.4.3.8. See Table 10 for details.
| Attribute | Value | |||||
| BrowseName | Total | |||||
| References | Node Class | BrowseName | DataType | TypeDefinition | ModellingRule | |
|---|---|---|---|---|---|---|
| HasTypeDefinition | Object Type | AggregateFunctionType | ||||
| Conformance Units | ||||||
|---|---|---|---|---|---|---|
| Aggregates - Total |
4.2.2.8 Total2 Aggregate Object
The Total2 Aggregate Object is an instance of AggregateFunctionType and represents the total 2 aggregate function defined in 5.4.3.9. See Table 11 for details.
| Attribute | Value | |||||
| BrowseName | Total2 | |||||
| References | Node Class | BrowseName | DataType | TypeDefinition | ModellingRule | |
|---|---|---|---|---|---|---|
| HasTypeDefinition | Object Type | AggregateFunctionType | ||||
| Conformance Units | ||||||
|---|---|---|---|---|---|---|
| Aggregates - Total2 |
4.2.2.9 Minimum Aggregate Object
The Minimum Aggregate Object is an instance of AggregateFunctionType and represents the minimum aggregate function defined in 5.4.3.10. See Table 12 for details.
| Attribute | Value | |||||
| BrowseName | Minimum | |||||
| References | Node Class | BrowseName | DataType | TypeDefinition | ModellingRule | |
|---|---|---|---|---|---|---|
| HasTypeDefinition | Object Type | AggregateFunctionType | ||||
| Conformance Units | ||||||
|---|---|---|---|---|---|---|
| Aggregates - Minimum |
4.2.2.10 Maximum Aggregate Object
The Maximum Aggregate Object is an instance of AggregateFunctionType and represents the maximum aggregate function defined in 5.4.3.11. See Table 13 for details.
| Attribute | Value | |||||
| BrowseName | Maximum | |||||
| References | Node Class | BrowseName | DataType | TypeDefinition | ModellingRule | |
|---|---|---|---|---|---|---|
| HasTypeDefinition | Object Type | AggregateFunctionType | ||||
| Conformance Units | ||||||
|---|---|---|---|---|---|---|
| Aggregates - Maximum |
4.2.2.11 MinimumActualTime Aggregate Object
The MinimumActualTime Aggregate Object is an instance of AggregateFunctionType and represents the minimum actual time aggregate function defined in 5.4.3.12. See Table 14 for details.
| Attribute | Value | |||||
| BrowseName | MinimumActualTime | |||||
| References | Node Class | BrowseName | DataType | TypeDefinition | ModellingRule | |
|---|---|---|---|---|---|---|
| HasTypeDefinition | Object Type | AggregateFunctionType | ||||
| Conformance Units | ||||||
|---|---|---|---|---|---|---|
| Aggregates - MinimumActualTime |
4.2.2.12 MaximumActualTime Aggregate Object
The MaximumActualTime Aggregate Object is an instance of AggregateFunctionType and represents the maximum actual time aggregate function defined in 5.4.3.13. See Table 15 for details.
| Attribute | Value | |||||
| BrowseName | MaximumActualTime | |||||
| References | Node Class | BrowseName | DataType | TypeDefinition | ModellingRule | |
|---|---|---|---|---|---|---|
| HasTypeDefinition | Object Type | AggregateFunctionType | ||||
| Conformance Units | ||||||
|---|---|---|---|---|---|---|
| Aggregates - MaximumActualTime |
4.2.2.13 Range Aggregate Object
The Range Aggregate Object is an instance of AggregateFunctionType and represents the range aggregate function defined in 5.4.3.14. See Table 16 for details.
| Attribute | Value | |||||
| BrowseName | Range | |||||
| References | Node Class | BrowseName | DataType | TypeDefinition | ModellingRule | |
|---|---|---|---|---|---|---|
| HasTypeDefinition | Object Type | AggregateFunctionType | ||||
| Conformance Units | ||||||
|---|---|---|---|---|---|---|
| Aggregates - Range |
4.2.2.14 Minimum2 Aggregate Object
The Minimum2 Aggregate Object is an instance of AggregateFunctionType and represents the minimum 2 aggregate function defined in 5.4.3.15. See Table 17 for details.
| Attribute | Value | |||||
| BrowseName | Minimum2 | |||||
| References | Node Class | BrowseName | DataType | TypeDefinition | ModellingRule | |
|---|---|---|---|---|---|---|
| HasTypeDefinition | Object Type | AggregateFunctionType | ||||
| Conformance Units | ||||||
|---|---|---|---|---|---|---|
| Aggregates - Minimum2 |
4.2.2.15 Maximum2 Aggregate Object
The Maximum2 Aggregate Object is an instance of AggregateFunctionType and represents the maximum 2 aggregate function defined in 5.4.3.16. See Table 18 for details.
| Attribute | Value | |||||
| BrowseName | Maximum2 | |||||
| References | Node Class | BrowseName | DataType | TypeDefinition | ModellingRule | |
|---|---|---|---|---|---|---|
| HasTypeDefinition | Object Type | AggregateFunctionType | ||||
| Conformance Units | ||||||
|---|---|---|---|---|---|---|
| Aggregates - Maximum2 |
4.2.2.16 MinimumActualTime2 Aggregate Object
The MinimumActualTime2 Aggregate Object is an instance of AggregateFunctionType and represents the minimum actual time 2 aggregate function defined in 5.4.3.17. See Table 19 for details.
| Attribute | Value | |||||
| BrowseName | MinimumActualTime2 | |||||
| References | Node Class | BrowseName | DataType | TypeDefinition | ModellingRule | |
|---|---|---|---|---|---|---|
| HasTypeDefinition | Object Type | AggregateFunctionType | ||||
| Conformance Units | ||||||
|---|---|---|---|---|---|---|
| Aggregates - MinimumActualTime2 |
4.2.2.17 MaximumActualTime2 Aggregate Object
The MaximumActualTime2 Aggregate Object is an instance of AggregateFunctionType and represents the maximum actual time 2 aggregate function defined in 5.4.3.18. See Table 20 for details.
| Attribute | Value | |||||
| BrowseName | MaximumActualTime2 | |||||
| References | Node Class | BrowseName | DataType | TypeDefinition | ModellingRule | |
|---|---|---|---|---|---|---|
| HasTypeDefinition | Object Type | AggregateFunctionType | ||||
| Conformance Units | ||||||
|---|---|---|---|---|---|---|
| Aggregates - MaximumActualTime2 |
4.2.2.18 Range2 Aggregate Object
The Range2 Aggregate Object is an instance of AggregateFunctionType and represents the range 2 aggregate function defined in 5.4.3.19. See Table 21 for details.
| Attribute | Value | |||||
| BrowseName | Range2 | |||||
| References | Node Class | BrowseName | DataType | TypeDefinition | ModellingRule | |
|---|---|---|---|---|---|---|
| HasTypeDefinition | Object Type | AggregateFunctionType | ||||
| Conformance Units | ||||||
|---|---|---|---|---|---|---|
| Aggregates - Range2 |
4.2.2.19 Count Aggregate Object
The Count Aggregate Object is an instance of AggregateFunctionType and represents the count aggregate function defined in 5.4.3.21. See Table 22 for details.
| Attribute | Value | |||||
| BrowseName | Count | |||||
| References | Node Class | BrowseName | DataType | TypeDefinition | ModellingRule | |
|---|---|---|---|---|---|---|
| HasTypeDefinition | Object Type | AggregateFunctionType | ||||
| Conformance Units | ||||||
|---|---|---|---|---|---|---|
| Aggregates - Count |
4.2.2.20 DurationInStateZero Aggregate Object
The DurationInStateZero Aggregate Object is an instance of AggregateFunctionType and represents the duration in state zero aggregate function defined in 5.4.3.22. See Table 23 for details.
| Attribute | Value | |||||
| BrowseName | DurationInStateZero | |||||
| References | Node Class | BrowseName | DataType | TypeDefinition | ModellingRule | |
|---|---|---|---|---|---|---|
| HasTypeDefinition | Object Type | AggregateFunctionType | ||||
| Conformance Units | ||||||
|---|---|---|---|---|---|---|
| Aggregates - DurationInStateZero |
4.2.2.21 DurationInStateNonZero Aggregate Object
The DurationInStateNonZero Aggregate Object is an instance of AggregateFunctionType and represents the duration in state non-zero aggregate function defined in 5.4.3.23. See Table 24 for details.
| Attribute | Value | |||||
| BrowseName | DurationInStateNonZero | |||||
| References | Node Class | BrowseName | DataType | TypeDefinition | ModellingRule | |
|---|---|---|---|---|---|---|
| HasTypeDefinition | Object Type | AggregateFunctionType | ||||
| Conformance Units | ||||||
|---|---|---|---|---|---|---|
| Aggregates - DurationInStateNonZero |
4.2.2.22 NumberOfTransitions Aggregate Object
The NumberOfTransitions Aggregate Object is an instance of AggregateFunctionType and represents the number of transitions aggregate function defined in 5.4.3.24. See Table 25 for details.
| Attribute | Value | |||||
| BrowseName | NumberOfTransitions | |||||
| References | Node Class | BrowseName | DataType | TypeDefinition | ModellingRule | |
|---|---|---|---|---|---|---|
| HasTypeDefinition | Object Type | AggregateFunctionType | ||||
| Conformance Units | ||||||
|---|---|---|---|---|---|---|
| Aggregates - NumberOfTransitions |
4.2.2.23 Start Aggregate Object
The Start Aggregate Object is an instance of AggregateFunctionType and represents the start aggregate function defined in 5.4.3.25. See Table 26 for details.
| Attribute | Value | |||||
| BrowseName | Start | |||||
| References | Node Class | BrowseName | DataType | TypeDefinition | ModellingRule | |
|---|---|---|---|---|---|---|
| HasTypeDefinition | Object Type | AggregateFunctionType | ||||
| Conformance Units | ||||||
|---|---|---|---|---|---|---|
| Aggregates - Start |
4.2.2.24 End Aggregate Object
The End Aggregate Object is an instance of AggregateFunctionType and represents the end aggregate function defined in 5.4.3.26. See Table 27 for details.
| Attribute | Value | |||||
| BrowseName | End | |||||
| References | Node Class | BrowseName | DataType | TypeDefinition | ModellingRule | |
|---|---|---|---|---|---|---|
| HasTypeDefinition | Object Type | AggregateFunctionType | ||||
| Conformance Units | ||||||
|---|---|---|---|---|---|---|
| Aggregates - End |
4.2.2.25 Delta Aggregate Object
The Delta Aggregate Object is an instance of AggregateFunctionType and represents the delta aggregate function defined in 5.4.3.27. See Table 28 for details.
| Attribute | Value | |||||
| BrowseName | Delta | |||||
| References | Node Class | BrowseName | DataType | TypeDefinition | ModellingRule | |
|---|---|---|---|---|---|---|
| HasTypeDefinition | Object Type | AggregateFunctionType | ||||
| Conformance Units | ||||||
|---|---|---|---|---|---|---|
| Aggregates - Delta |
4.2.2.26 StartBound Aggregate Object
The StartBound Aggregate Object is an instance of AggregateFunctionType and represents the start bound aggregate function defined in 5.4.3.28. See Table 29 for details.
| Attribute | Value | |||||
| BrowseName | StartBound | |||||
| References | Node Class | BrowseName | DataType | TypeDefinition | ModellingRule | |
|---|---|---|---|---|---|---|
| HasTypeDefinition | Object Type | AggregateFunctionType | ||||
| Conformance Units | ||||||
|---|---|---|---|---|---|---|
| Aggregates - StartBound |
4.2.2.27 EndBound Aggregate Object
The EndBound Aggregate Object is an instance of AggregateFunctionType and represents the end bound aggregate function defined in 5.4.3.29. See Table 30 for details.
| Attribute | Value | |||||
| BrowseName | EndBound | |||||
| References | Node Class | BrowseName | DataType | TypeDefinition | ModellingRule | |
|---|---|---|---|---|---|---|
| HasTypeDefinition | Object Type | AggregateFunctionType | ||||
| Conformance Units | ||||||
|---|---|---|---|---|---|---|
| Aggregates - EndBound |
4.2.2.28 DeltaBounds Aggregate Object
The DeltaBounds Aggregate Object is an instance of AggregateFunctionType and represents the delta bounds aggregate function defined in 5.4.3.30. See Table 31 for details.
| Attribute | Value | |||||
| BrowseName | DeltaBounds | |||||
| References | Node Class | BrowseName | DataType | TypeDefinition | ModellingRule | |
|---|---|---|---|---|---|---|
| HasTypeDefinition | Object Type | AggregateFunctionType | ||||
| Conformance Units | ||||||
|---|---|---|---|---|---|---|
| Aggregates - DeltaBounds |
4.2.2.29 DurationGood Aggregate Object
The DurationGood Aggregate Object is an instance of AggregateFunctionType and represents the duration good aggregate function defined in 5.4.3.31. See Table 32 for details.
| Attribute | Value | |||||
| BrowseName | DurationGood | |||||
| References | Node Class | BrowseName | DataType | TypeDefinition | ModellingRule | |
|---|---|---|---|---|---|---|
| HasTypeDefinition | Object Type | AggregateFunctionType | ||||
| Conformance Units | ||||||
|---|---|---|---|---|---|---|
| Aggregates - DurationGood |
4.2.2.30 DurationBad Aggregate Object
The DurationBad Aggregate Object is an instance of AggregateFunctionType and represents the duration bad aggregate function defined in 5.4.3.32. See Table 33 for details.
| Attribute | Value | |||||
| BrowseName | DurationBad | |||||
| References | Node Class | BrowseName | DataType | TypeDefinition | ModellingRule | |
|---|---|---|---|---|---|---|
| HasTypeDefinition | Object Type | AggregateFunctionType | ||||
| Conformance Units | ||||||
|---|---|---|---|---|---|---|
| Aggregates - DurationBad |
4.2.2.31 PercentGood Aggregate Object
The PercentGood Aggregate Object is an instance of AggregateFunctionType and represents the percent good aggregate function defined in 5.4.3.33. See Table 34 for details.
| Attribute | Value | |||||
| BrowseName | PercentGood | |||||
| References | Node Class | BrowseName | DataType | TypeDefinition | ModellingRule | |
|---|---|---|---|---|---|---|
| HasTypeDefinition | Object Type | AggregateFunctionType | ||||
| Conformance Units | ||||||
|---|---|---|---|---|---|---|
| Aggregates - PercentGood |
4.2.2.32 PercentBad Aggregate Object
The PercentBad Aggregate Object is an instance of AggregateFunctionType and represents the percent bad aggregate function defined in 5.4.3.34. See Table 35 for details.
| Attribute | Value | |||||
| BrowseName | PercentBad | |||||
| References | Node Class | BrowseName | DataType | TypeDefinition | ModellingRule | |
|---|---|---|---|---|---|---|
| HasTypeDefinition | Object Type | AggregateFunctionType | ||||
| Conformance Units | ||||||
|---|---|---|---|---|---|---|
| Aggregates - PercentBad |
4.2.2.33 WorstQuality Aggregate Object
The WorstQuality Aggregate Object is an instance of AggregateFunctionType and represents the worst quality aggregate function defined in 5.4.3.35. See Table 36 for details.
| Attribute | Value | |||||
| BrowseName | WorstQuality | |||||
| References | Node Class | BrowseName | DataType | TypeDefinition | ModellingRule | |
|---|---|---|---|---|---|---|
| HasTypeDefinition | Object Type | AggregateFunctionType | ||||
| Conformance Units | ||||||
|---|---|---|---|---|---|---|
| Aggregates - WorstQuality |
4.2.2.34 WorstQuality2 Aggregate Object
The WorstQuality2 Aggregate Object is an instance of AggregateFunctionType and represents the worst quality 2 aggregate function defined in 5.4.3.36. See Table 37 for details.
| Attribute | Value | |||||
| BrowseName | WorstQuality2 | |||||
| References | Node Class | BrowseName | DataType | TypeDefinition | ModellingRule | |
|---|---|---|---|---|---|---|
| HasTypeDefinition | Object Type | AggregateFunctionType | ||||
| Conformance Units | ||||||
|---|---|---|---|---|---|---|
| Aggregates - WorstQuality2 |
4.2.2.35 AnnotationCount Aggregate Object
The AnnotationCount Aggregate Object is an instance of AggregateFunctionType and represents the annotation count aggregate function defined in 5.4.3.20. See Table 38 for details.
| Attribute | Value | |||||
| BrowseName | AnnotationCount | |||||
| References | Node Class | BrowseName | DataType | TypeDefinition | ModellingRule | |
|---|---|---|---|---|---|---|
| HasTypeDefinition | Object Type | AggregateFunctionType | ||||
| Conformance Units | ||||||
|---|---|---|---|---|---|---|
| Aggregates - AnnotationCount |
4.2.2.36 StandardDeviationSample Aggregate Object
The StandardDeviationSample Aggregate Object is an instance of AggregateFunctionType and represents the standard deviation sample aggregate function defined in 5.4.3.37. See Table 39 for details.
| Attribute | Value | |||||
| BrowseName | StandardDeviationSample | |||||
| References | Node Class | BrowseName | DataType | TypeDefinition | ModellingRule | |
|---|---|---|---|---|---|---|
| HasTypeDefinition | Object Type | AggregateFunctionType | ||||
| Conformance Units | ||||||
|---|---|---|---|---|---|---|
| Aggregates - StandardDeviationSample |
4.2.2.37 VarianceSample Aggregate Object
The VarianceSample Aggregate Object is an instance of AggregateFunctionType and represents the variance sample aggregate function defined in 5.4.3.38. See Table 40 for details.
| Attribute | Value | |||||
| BrowseName | VarianceSample | |||||
| References | Node Class | BrowseName | DataType | TypeDefinition | ModellingRule | |
|---|---|---|---|---|---|---|
| HasTypeDefinition | Object Type | AggregateFunctionType | ||||
| Conformance Units | ||||||
|---|---|---|---|---|---|---|
| Aggregates - VarianceSample |
4.2.2.38 StandardDeviationPopulation Aggregate Object
The StandardDeviationPopulation Aggregate Object is an instance of AggregateFunctionType and represents the standard deviation population aggregate function defined in 5.4.3.39. See Table 41 for details.
| Attribute | Value | |||||
| BrowseName | StandardDeviationPopulation | |||||
| References | Node Class | BrowseName | DataType | TypeDefinition | ModellingRule | |
|---|---|---|---|---|---|---|
| HasTypeDefinition | Object Type | AggregateFunctionType | ||||
| Conformance Units | ||||||
|---|---|---|---|---|---|---|
| Aggregates - StandardDeviationPopulation |
4.2.2.39 VariancePopulation Aggregate Object
The VariancePopulation Aggregate Object is an instance of AggregateFunctionType and represents the variance population aggregate function defined in 5.4.3.40. See Table 42 for details.
| Attribute | Value | |||||
| BrowseName | VariancePopulation | |||||
| References | Node Class | BrowseName | DataType | TypeDefinition | ModellingRule | |
|---|---|---|---|---|---|---|
| HasTypeDefinition | Object Type | AggregateFunctionType | ||||
| Conformance Units | ||||||
|---|---|---|---|---|---|---|
| Aggregates - VariancePopulation |
4.3 MonitoredItem AggregateFilter
4.3.1 MonitoredItem AggregateFilter Defaults
The default values used for MonitoredItem Aggregates are the same as those used for historical Aggregates. They are defined in 4.2.1.2. For additional information on MonitoredItem AggregateFilter see OPC 10000-4.
4.3.2 MonitoredItem Aggregates and Bounding Values
When calculating MonitoredItem Aggregates that require the use of Bounding Values, the bounds may not be known. The calculation is done in the same manner as a historical read with the Partial Bit set. The historian may wait some amount of time (normally no more than one processing interval) before calculating the interval to allow for any latency in data collection and reduce the use of the Partial Bit.
A historical read done after data collection and the data from the MonitoredItem over the same interval may not be the same.
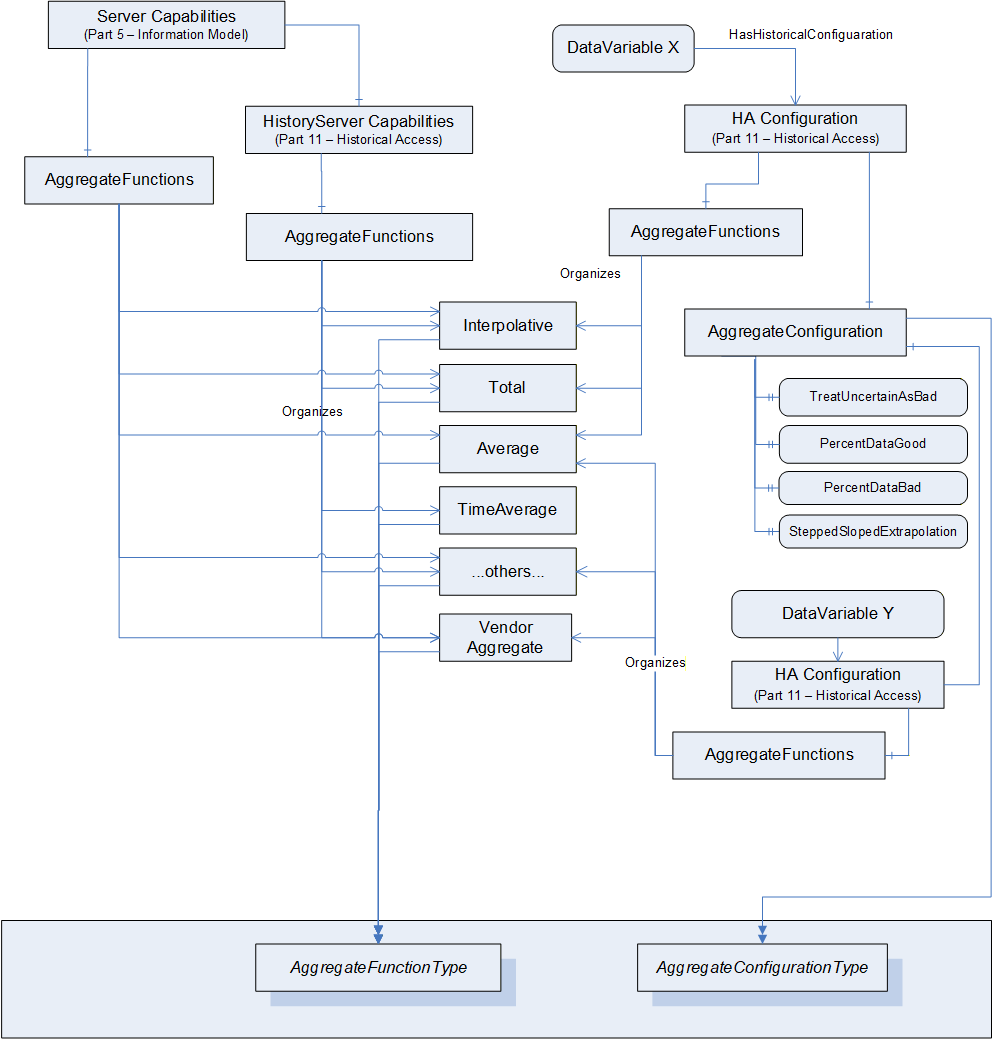
4.4 Exposing Supported Functions and Capabilities
Figure 1 outlines a possible representation of Aggregate information in the AddressSpace. In this example, although the Server at the highest level may support Aggregate functionality for Interpolative, Total, Average, and others, DataVariable X only supports Interpolative, Total and Average, while DataVariable Y supports Average, a vendor defined Aggregate and other (unstated) Aggregates.