Errata exists for this version of the document.
YArrayItemType represents a single-dimensional array of numerical values used to represent spectra or distributions where the x axis intervals are constant. YArrayItemType is formally defined in Table 8.
Table 8 – YArrayItemType definition
|
Attribute |
Value |
||||
|
BrowseName |
YArrayItemType |
||||
|
IsAbstract |
False |
||||
|
ValueRank |
1 |
||||
|
DataType |
BaseDataType |
||||
|
ArrayDimensions |
{0} (0 = UnknownSize) |
||||
|
References |
NodeClass |
BrowseName |
DataType |
TypeDefinition |
ModellingRule |
|
Subtype of the ArrayItemType defined in 5.3.4.1 |
|||||
|
|
|
|
|
|
|
|
HasProperty |
Variable |
XAxisDefinition |
AxisInformation |
PropertyType |
Mandatory |
The Value of the YArrayItem contains the numerical values for the Y-Axis. Engineering Units and Range for the Value are defined by corresponding Properties inherited from the ArrayItemType.
The DataType of this VariableType is restricted to SByte, Int16, Int32, Int64, Float, Double, ComplexNumberType and DoubleComplexNumberType.
The XAxisDefinition Property holds the information about the Engineering Units and Range for the X-Axis.
The StatusCode SemanticsChanged bit shall be set if any of the following five Properties are changed: InstrumentRange, EURange, EngineeringUnits, Title or XAxisDefinition (see 5.2 for additional information).
Figure 3 shows an example of how Attributes and Properties may be used in a graphical interface.
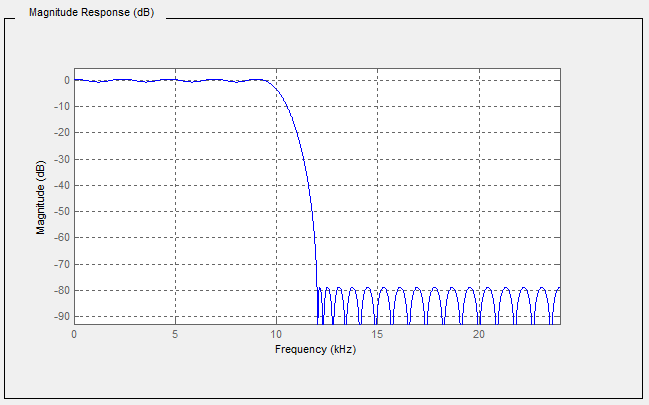
Figure 3 – Graphical view of a YArrayItem
Table 9 describes the values of each element presented in Figure 3.
Table 9 – YArrayItem item description
|
Attribute / Property |
Item value |
|
Description |
Magnitude Response (dB) |
|
axisScaleType |
AxisScaleEnumeration.LINEAR_0 |
|
InstrumentRange.low |
-90 |
|
InstrumentRange.high |
5 |
|
EURange.low |
-90 |
|
EURange.high |
2 |
|
EngineeringUnits.namespaceUrl |
|
|
EngineeringUnits.unitId |
2N |
|
EngineeringUnits.displayName |
“en-us”, “dB” |
|
EngineeringUnits.description |
“en-us”, “decibel” |
|
Title |
Magnitude |
|
XAxisDefinition.EngineeringUnits.namespaceUrl |
|
|
XAxisDefinition.EngineeringUnits.unitId |
kHz |
|
XAxisDefinition.EngineeringUnits.displayName |
“en-us”, “kHz” |
|
XAxisDefinition.EngineeringUnits.description |
“en-us”, “kilohertz” |
|
XAxisDefinition.Range.low |
0 |
|
XAxisDefinition.Range.high |
25 |
|
XAxisDefinition.title |
“en-us”, “Frequency” |
|
XAxisDefinition.axisScaleType |
AxisScaleEnumeration.LINEAR_0 |
|
XAxisDefinition.axisSteps |
null |
Interpretation notes:
- Not all elements of this table are used in the graphic.
- The X axis is displayed in reverse order, however, the XAxisDefinition.Range.low shall be lower than XAxisDefinition.Range.high. It is only a graphical representation that reverses the display order.
- There is a constant X axis